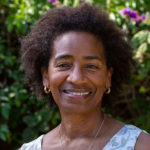
Carmen Leedham

Education: B.A. in Geography (San Diego State University)

The following profile was compiled by Jessica Embury (San Diego State University) for the Encoding Geography initiative. To learn more, visit: https://www.ncrge.org/encoding-geography/


Please describe your job, employer, and the primary tasks you perform in your position. 

I work for the County of San Diego, Health and Human Services Agency in the Office of Business Intelligence. The office I work for is a support department that works with other offices within the Health and Human Services Agency, such as Aging and Independent Services and Public Health Services. The primary tasks I perform revolve around GIS. I create static maps, web maps, and perform geospatial analysis to answer questions posed by leadership and my coworkers. For example, I performed geospatial analysis to convert tabular data into spatial data to answer, “How many CalFresh recipients live in each district in the County of San Diego?”  

What is your educational background? How did you initially discover geocomputation and why did you ultimately choose a career that uses geography and computer science? 

The people I met during my education have been instrumental in the trajectory of my career and have been very important to me. I first came into contact with geocomputation after completing a cultural geography course at Grossmont College with Professor Mark Goodman. He told me what a career in geography might look like and he encouraged me to enroll in an “Intro to GIS” course. At first, I did not understand anything, but the professors were so helpful and they made time for their students. I never had any computer classes in high school or middle school so learning how to work with a computer was very new to me. 

About a year later, I applied for an internship with the County of San Diego, Health and Human Services Agency in GIS. From there, I started to learn important skills, like how to work in a professional office, how to email people, and how to communicate with people in a professional setting. I started to really like it and see a life for myself working in GIS for a local government.   

At the time, I was 18 or 19 and I was going through a lot – I had unstable housing and food insecurity. I wasn’t sure how I was going to make it day-to-day or month-to-month. I saw GIS as a path to achieve the things I wanted: stable housing and a little bit of fun money. From that point forward, I started thinking about how to get a career in GIS as quickly as possible. In May 2019, I completed the GIS technician certificate of achievement at Mesa College – the requirement to get an entry level job in GIS with the County of San Diego. In September 2019, I got a full-time job with the County of San Diego in the Land Use and Environment Group. Since then, I’ve been with the County of San Diego, moving up and honing my skills in GIS.  

When thinking about geography, what specific background knowledge and conceptual ideas are important and useful to know? 

I feel like geography – both physical and cultural geography – cannot be separated from GIS or geocomputation. The foundation of geospatial analysis builds upon cultural and human relation to place and space throughout time. Likewise, GIS builds upon physical geography and knowledge of our surroundings.  

I mainly focus on cultural geography and the socioeconomic conditions of people within the Health and Human Services Agency of the County of San Diego. So, with geocomputation, we run the risk of turning people, plants, and places into numbers or into commodities and binaries. Through geography, we can return people from numbers and binaries back into real life things that have special life circumstances and value to one another.  

Conceptually, an understanding of sustainability should be gathered prior to working in geocomputation. Our actions have consequences, both positive and adverse, and this is something we should take into consideration in our day-to-day interactions. Our work always revolves around the three pillars of sustainability: people, profit, and planet.  

When thinking about computer science, what specific background knowledge and conceptual ideas do you think are important and useful to know? 

I recommend starting with the basics like: What are hard drives? What are the different types of hard drives and what do they do? What is the central processing unit of a computer? What’s a good one or a bad one? How much memory does the computer or device have?   

Then, you need to understand different types of software. Think about your needs and what software can meet the questions posed by your research. From there, you have to learn how to use the software. What file type does the software use? How are these files opened in the software? How are they saved on your computer?   

When I started GIS, I went to buy a laptop and I thought, “Okay, I need something that can handle the amount of data I’m going to be running and the strain I’m going to be putting on my computer.” I had to look at things like core memory and plan accordingly, because there are times that your computer will be overworked.  

What procedural knowledge is important to know, from either geography or computer science, in your work? 

It is important to know how to isolate your question, so things like the scientific method can be helpful. You don’t need to follow it exactly, but it can help you identify methodology to solve the question. What information do I need to solve this problem? Does this information exist in the format I need and, if not, can I create this information or do I know someone that can assist me in gathering this information? 

From there, test your methodology. Be flexible because a lot of things aren’t going to work and you need a plan B, C, D, and so on. It’s very helpful to know people within your line of work so you can ask questions and be nudged along in the direction you need.  

Can you share a specific example of how you apply geography and computer science to analyze and solve problems related to important issues?  

Since March 2020, when the novel coronavirus entered the United States, the County of San Diego tried to get ahead of it. We had public health scares in the past, like the Hepatitis A outbreak, so we had a little bit of a framework. 

My office develops and maintains a publicly available web map application for locations with publicly funded hand washing stations and public restrooms targeted for use by individuals experiencing homelessness. The County of San Diego hoped to prevent the spread of COVID-19 by placing hand washing stations and portable restrooms in locations that have known homeless encampment sites.  

What kind of geographic questions did you ask and think about during this project?  

The Office of Business Intelligence did not have to decide where the washing stations would go, but we relied on spatial data about homeless encampments to show hotspots and clusters of people experiencing homelessness.  

Someone else using this data would say, “Let’s place a hand washing station on this street where there are a lot of people experiencing homelessness,” and from there, I would receive the name of the street that this hand washing station is on and other internal information, such as how long it will be serviced or problems with the station itself. I would then convert this tabular data into spatial data. Addresses are not spatial data because there are no latitude or longitude coordinates connected to them. These coordinates are necessary to perform geocomputation, otherwise, it’s just data on your computer.  

We ended up creating a public web map application. I published the data as a hosted feature service on ArcGIS Online and I update it every so often. I had to think about possible problems with sharing this data with a large audience. We didn’t know how many people from the public would be looking at this map and a lot of pings could cause the map to be slow or stop working. I had to think of these problems ahead of time because if this map were to go down then the public would ask questions.   

In doing this project, I had to understand the software I was working with and the data formats. I had to think about whether the public would have problems viewing the map, and whether the data was understandable and digestible to the audience.  

What types of data did you acquire to support your project? Please identify up to three data sets that you utilize the most. 

I frequently perform geocoding to assign latitude and longitude to an address using an address locator. An address locator consists of different road networks of polylines within an area. For example, SANDAG publishes a dataset called “roads_all” that contains road types, road names, and address ranges. The address locator matches the tabular address data to spatial data in the road network and then converts the tabular data into spatial data. 

Since we have so many geocoding requests, we work on building the best address locator to match with the most addresses in the least amount of time and with the highest accuracy. We use “roads_all” from SANDAG as well as a road network from ESRI. We also use TIGER/Line shapefiles from the US Census Bureau because sometimes people have mailing addresses outside of the County of San Diego. I combined these road network datasets to produce a composite address locator that I worked with daily for this project. I also used the point in time homeless count from the San Diego Regional Task Force on Homelessness as well as internal data sent by my coworkers in neighboring offices. 

What types of content, knowledge, and skills did you use to evaluate the project and analyze the data gathered for your project? 

Something I wasn’t prepared for was the amount of general skills, like Excel and Word, needed to perform day-to-day tasks. Communication is another huge part of my job, so I have to understand the needs of the project, the questions answered by the project, and how to provide deliverables to the customer. The customer could be one of my coworkers in an office or it can be the public. 

With the hand washing stations and portable restrooms web map, I needed to make sure that the data was always up to date and that the data could handle being updated frequently. I needed a huge understanding of ArcGIS Online and that suite of products. Another aspect was working with firewalls. I work in a secure network that the public cannot access, so I needed to get private data to the public and ensure that it met requirements to share with the public.   

More specific skills I used are geocoding, creating an address locator, creating web maps, and creating web applications. 

How did you apply geography and computer science to communicate the results of your project? Do you have a recent product or publication that you could share with us as an example? 

https://211sandiego.org/covid19/covid-19-information/ 

The web map of hand washing stations and portable restrooms is on 211 San Diego and contains hand washing station icons and portable restroom icons. Using this map, you can enter an address to see where the nearest hand washing station or portable restroom is. You can click on an icon and get additional pop-up information.   

To create this map, I had to use Excel, bring the Excel spreadsheet into ArcGIS Pro, geocode the data set with my composite address locator, create a feature class in my geodatabase, and publish it online for the public to view. Once published on ArcGIS Online, the data is stored in the cloud and is referred to as a hosted feature service. I had to ensure the sharing capabilities were correct so other people – like students – can bring this data into their own maps. Then, I had to make sure that there were no technical problems on the backend which would make the map stop working.  

When reflecting on your work, how does it align with your personal values and your community/civic interests? 

I used to be a customer of the County of San Diego and I used to receive CalFresh. I saw how the County of San Diego helped me, I see how it helps other people who are in that situation, and I know that some good is being done. That is rewarding to me. The things that I care about are making sure that people are able to live well and thrive, rather than just survive and get by. It’s nice to know that there is a group of people working to make sure that the basic needs of our community are met, and that resources are available. 

For me, public web maps are key because we can show the public that there are resources available. People don’t always know what’s available to them and we need to share the work that we’re doing and what the County of San Diego provides. I like working for an organization that is helping people and making sure that things are working as they should be. It makes me feel good — like harm reduction is occurring.   


This material is based upon work supported by the National Science Foundation under Grants No. 2031418, 2031407, and 2031380 (Collaborative Research: Encoding Geography – Scaling up an RPP to achieve inclusive geocomputational education). Any opinions, findings, and conclusions or recommendations expressed in this material are those of the author(s) and do not necessarily reflect the views of the National Science Foundation 
 

    Share

Meghan Dilworth and Samantha Hinton Intern at AAG for Summer 2022 Semester

Two new interns have joined the AAG staff this summer! The AAG would like to welcome Meghan and Samantha to the organization.

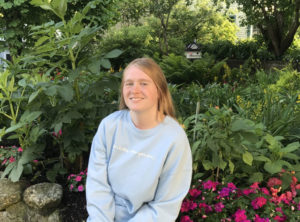
Photo of Meghan Dilworth Meghan Dilworth is a senior at Arizona State University (ASU), pursuing a B.A. in Geography and Urban Planning. Meghan has been a Teaching Assistant/Mentor in the ASU Geography department for three years. Additionally, she has worked as a Geography Content Curator at SolarSPELL, a company that collects geography and educational information for people in areas that don’t have access to the internet or traditional libraries, such as East Africa or the Pacific Islands. In her spare time Meghan’s interests include travel, snow skiing, horseback riding and gymnastics.
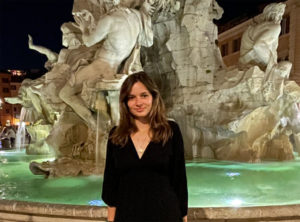
Samantha HintonSamantha Hinton was born and raised in New York City where she graduated from The Spence School. She currently attends Trinity College Dublin, pursuing a B.A. major in Geography.  At Trinity, she is the geography library undergraduate representative, a Student 2 Student Mentor, part of the women’s soccer team, and the treasurer of the Geographical Society. She has spent the last six months doing her Erasmus at Utrecht University in The Netherlands. Samantha chose to apply for geography because she is passionate about appreciating the outdoors. With geography, she strives to learn more about the intersection and impact between humans, space, and the environment. While not working, she enjoys traveling, making art, and playing sports.
If you or someone you know is interested in applying for an internship at the AAG, the AAG seeks interns on a year-round basis for the spring, summer, and fall semesters. Currently, due to COVID-19 safety regulations AAG interns are home-based employees.

Learn about AAG internships
    Share

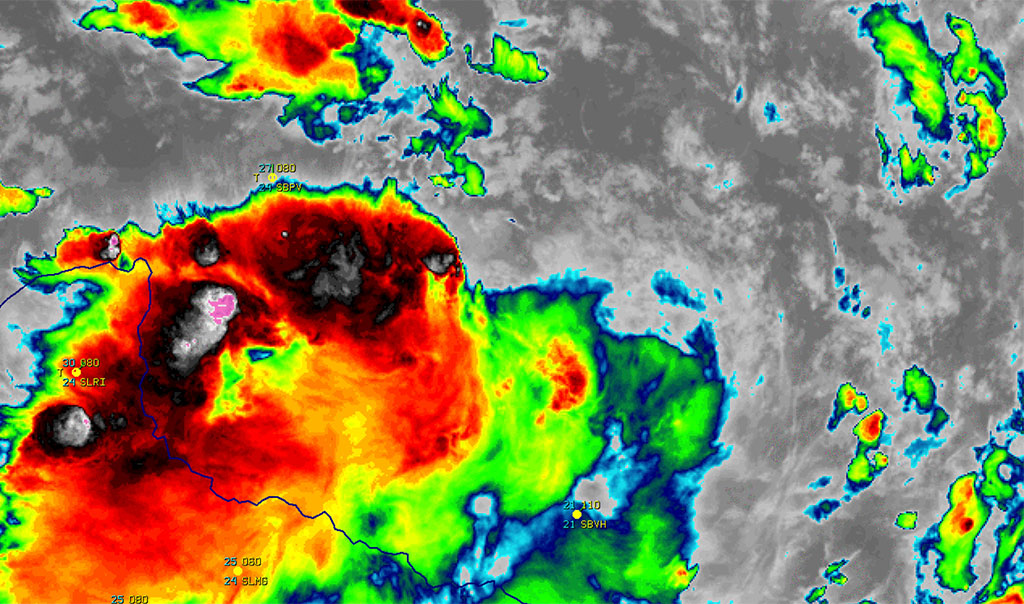
Silver Linings in a Mesoscale Convective Complex

Mesoscale convective vortex over Brazil. Credit: NASA
Credit: NASA

Toward a Brighter Post-Pandemic World 

Photo of Marilyn Raphael by Ashley Kruythoff, UCLA

I begin this year of my presidency feeling thankful. Thankful that I survived the pandemic (so far!) and thankful for the opportunity to serve my discipline at this level. So, before I write another word, I want to say thank you for giving me this opportunity. I did not imagine, indeed, could never have imagined becoming president of this Association when as a child my interest in geography began to develop. I am looking forward to working with the Council on matters of importance to geography and to the members of the AAG. I am looking forward to going to the regional meetings this fall and doing my part to support and encourage the work that the regions are doing. I firmly believe that as its regional divisions thrive, so will the whole Association.  

In this column, I’ll focus on the effect of the pandemic on us. I want to acknowledge here our three previous presidents who served their terms under the shadow of COVID-19, as well as our Executive Director Gary Langham who has only known the AAG during the pandemic. David Kaplan was there in March 2020, just as these changes had begun, writing a compassionate column warning of the threat, pointing out how well positioned geography is to help us understand the threat, and asking us to be careful ourselves and to look out for others. Amy Lobben served her term completely virtually, and Emily Yeh’s term was almost completely virtual. Their stewardship has meant that the AAG has not only survived the pandemic, but seized opportunities to re-envision its service to members.   

I’m beginning my presidency at a peculiar time in the AAG’s history. For the past two and a half years we’ve been living with a pandemic, forced by the extremely contagious novel coronavirus – COVID-19. This virus and our response to it have changed the way we live and work, the economy, and society, in fundamental ways, some of which we will only recognize in coming years. And these changes are not limited to the US. They are worldwide.   

Emergence from the pandemic has not been a smooth transition back to normal, probably because that pre-2020 normal does not exist anymore. We are now in what some call a new normal, and others the post-pandemic world. I wonder, is it true that we are post—pandemic, and if it is, what exactly does that mean? How has this experience changed what and how we think, as well as how we live our lives? How much of that change is good? How much of it do we need to undo? What has not changed and needs to change? What has changed but not enough, so that we still need to work on it? What has changed that we need to keep in its new form? I have a lot of questions.   

Emergence from the pandemic has not been a smooth transition back to normal, probably because that pre-2020 normal does not exist anymore.

Over the course of the last two and a half years I have been actively looking at these changes with the express aim of seeing what good I could extract. One might say, actively trying to find the silver lining in the mesoscale convective complex that is COVID-19. It is not an easy task, but I did not want to emerge from the pandemic with nothing positive to show for all of the chaos that it caused. Here is some of what I found. 

COVID-19 separated us from each other. Our first response to the virus was to isolate ourselves, either due to official lockdowns or by choice and concern. In that justifiable fear for our lives before vaccines became freely available, we withdrew, stayed home, worked from home, attended classes from home, and tried to play at home. For many of us this was fine. We took the opportunity to focus on family life, DIY projects abounded, selfcare ascended as a vital approach to our days. For many of us, though, the lockdown phase of the pandemic was hugely problematic. Many people could not stay home or lost their jobs because employers depended on us to show up, but we withdrew. Trying to work/teach/host/attend meetings online from an active home was difficult, sometimes embarrassing. And yes, sometimes, that home to which we withdrew was not a safe space. My silver lining (and I realized later, that of many others) is the weekly family Zoom meetings that my brother instituted. We are a large family living in several countries, thousands of miles apart from each other and we had the real fear that isolation forced by Covid would destroy our connectedness. The weekly Zoom meetings have helped to keep us connected even more tightly than we were before the pandemic began.   

What has changed that we need to keep in its new form?  What has changed but not enough so that we still need to work on it?  

We changed how we travelled and communicated. We greatly limited airplane travel and drove fewer miles, especially those who stopped commuting to work. Texts and phone calls and social media were no longer backed up by in-person social events or the daily meetings and conversations at work. Our annual meetings, where we met our colleagues, renewed friendships and collaborations, and shared our research, went virtual. And, despite the heroic attempts of our tech people, virtual spaces cannot compare to in-person for maintaining those vital connections. One—alas temporary—silver lining here was an immediate and significant effect on the levels of atmospheric pollution in major cities around the globe. In Los Angeles, where I “isolated” I have never seen such brilliantly blue skies except perhaps the day after a storm passed over. The pandemic showed us that we could substantially cut emissions of greenhouse gases if we were forced to. Another, more enduring, silver lining here is that as we are emerging from the crisis and able to again meet in person, we have also learned the value—especially for cost, and access—of maintaining a virtual option.   

COVID-19 negatively affected our academic units. One of my tasks as Vice President was to organize and host the Departmental Chairs’ Luncheon. As a part of preparing for the discussion, the group was polled for topics of interest. Advice on how to deal with the negative impacts of COVID-19 on their departments was the topic most often mentioned. Their concerns ranged from work overload and burnout to low faculty morale and the fear that the pandemic had forced structural changes, often bringing student and faculty and staff expectations into conflict. These underscored for me how negatively affected we have been by the pandemic and the urgent need to take steps to support our faculty and students in the wake of the pandemic. But the discussion around these issues also revealed to me how strong the desire is to come through this safely and to use what we have learnt to make stronger, more caring departments and indeed a stronger and more caring AAG. It is an opportunity for the AAG to become more relevant to its membership and to the broader community as we emerge from the pandemic.   

Changing For Good

This year as President I want to focus on bringing AAG to a sustainable post-pandemic state. I want us to take advantage of the new opportunities that have developed over the past two and a half years. I begin in this column by addressing a couple of the questions that I raised earlier.   

What has changed that we need to keep in its new form? 

My answer here would be our approach to communicating. For example, there are ways we can improve the experience of virtual meetings at AAG. We do not have to completely sacrifice our annual in-person meeting; however, we should continue to expand and improve our virtual (and hybrid) capacity to provide thoughtful and well-executed options for participation. AAG is already providing new yearlong opportunities for us to engage with each other through Professional Development webinars for leaders and early-career geographers, as well as the Summer Series specifically for students. I can foresee membership growth with simultaneous reduced carbon footprint from this win-win approach. 

What has changed but not enough so that we still need to work on it?  

There are other answers here, but I will say that our awareness of inequality has heightened, supporting actions that were already started within the AAG. It is no coincidence that some of AAG’s most valuable programming under the Rapid Response to COVID-19–for example, Bridging the Digital Divide and the equity and mental health aspects of the Graduate Summer Series–were also meant to address longstanding inequities within the geography discipline, itself a mirror of inequities in society. As I said in my nomination statement for this presidency, COVID-19 brought these inequities into more prominence: “The legitimate fear of infection has led to an abrupt change in the way in which society operates and communicates, exposing the realities of our inequality.” While the trio of diversity, inclusion, and representation has been a focus in the AAG, it remains a critical issue, and AAG still has work to do to ensure that geography as a discipline becomes inclusive and equitable. We need to continue to work on reducing inequality and to address racial, social and environmental injustice, in our discipline. And the way to do this is through increased diversity, inclusion and representation of under-represented groups. I was excited to read the JEDI framework document and look forward to the implementation of its recommendations.   

The way ahead. The pandemic was/is a disruption of immense proportions. However, we geographers are a resilient bunch and because of this we will extract from this experience the pieces that will help us shape ourselves into a bigger/better/stronger organization. We will emerge and thrive, becoming really post-pandemic. I look forward to helping us get there.  

DOI: 10.14433/2017.0111


Please note: The ideas expressed in the AAG President’s column are not necessarily the views of the AAG as a whole. This column is traditionally a space in which the president may talk about their views or focus during their tenure as president of AAG, or spotlight their areas of professional work. Please feel free to email the president directly at raphael [at] geog [dot] ucla [dot] edu to enable a constructive discussion. 

    Share

Rebecca Grover

Education: M.A. in Geography (San Diego State University) B.A. in Geography, English (University of Vermont)

The following profile was compiled by Brendan Vander Weil (Texas State University) for the Encoding Geography initiative. To learn more, visit: https://www.ncrge.org/encoding-geography/


Please describe your job, employer, and the primary tasks you perform in your position.  

I am self-employed as a GIS analyst and consultant. In this position, I perform a wide variety of tasks to solve analytical problems and provide GIS solutions to clients. Most recently, I provided GIS support for a renewable energy development company. In this role, I ran and maintained a customized tool to extract land that would be suitable for solar energy development. I also provided customized GIS analyses, including a process for displaying areas of neighboring landowners with large acreages of land for potential solar development outreach. I also spent much time searching for and compiling data, such as parcels and endangered species and maintaining a variety of geodatabases for running tools and processes.   

What geographic knowledge, such as terminology and concepts, is important and useful to know in your line of work?   

For a recent client, it was beneficial to know basic physical geography concepts such as the definition of a 100-year flood zone, and knowledge of other FEMA-related data and concepts. In addition, understanding how parcel data is assessed and attributed was important to know as well as basic knowledge of environmental geography, such as state-listed versus federally-listed endangered species.   

What conceptual geographic knowledge is important and useful to know?   

For one renewable energy client, there was a significant element of interconnection and the importance of place as it related to the natural environment. Many different factors – such as the location of land, any constraints on the land, ownership of neighboring land, and governance of land – contributed to identifying potential sites for developing solar energy. Both general knowledge of how location is important to this work, as well as knowledge of environmental considerations, were useful to know.   

What procedural geographic knowledge is important and use to know?  

Knowing GIS and spatial analysis methods was crucial to performing this work as a GIS Analyst. Also, understanding where to look for downloadable spatial data and managing and interpreting said data was key to this role. Having a solid grasp of geoprocessing methods and procedures was also essential, as well as quality-checking and analyzing the results.    

What areas of computer science are important and useful to know?  

Definitely basic computer programming — such as Python (which is used with GIS).   

Can you provide an example of a project where you apply geography and computer science to analyze and solve problems related to important issues? 

For my most recent client, we were constantly looking for new land on which to develop solar energy. Therefore, one of my most common tasks was to run and maintain a customized tool in GIS to extract this developable land – the first step in assessing where to build solar and promote the advancement of renewables.   

What types of geographic questions did you ask and think about in your project?  

Before running the tool, I needed to ensure that the databases that the tool would connect to and iterate through were in the right location with the right datasets. The first question was, are the databases ready, and is all my data there? Next, if there was an error with the tool, I had to discover where the issue was and ask myself whether it was a data issue, a server connection issue, or something else. And when the tool finished running, I needed to examine the output and ask myself if the results made sense – did the flood zone and wetland layers appear to show correctly? Did the developable land align in a sensical way and did not overlap with the constraints layers? Were any data layers missing?   

What types of data did you acquire to support your project?  

I acquired many types of data for my project, with the following being the most critical: 

  • DEM tiles from USGS 
  • 100-year flood zone FEMA data 
  • Wetlands data from FWS 

What types of knowledge and skills, both geographic and general, do you use to evaluate, process, and analyze the data you gather for your work? 

I used my prior knowledge of working with DEMs and the Spatial Analyst extension to effectively download and organize DEM tiles from the USGS site and analyze the resulting slope data. For the 100-year flood zone data from FEMA, I used geoprocessing skills such as extracting data by attribute and exporting data between databases to process and organize the data to be ready for use in the tool. I used similar techniques to prepare the wetlands data. To analyze the output of the tool, I used a variety of content knowledge/skills like interpreting aerial imagery, quality checking spatial and attribute data for accuracy, and problem-solving/error tracking if something did not look right.   

How did you apply geography to communicate the results of your project? Do you have a recent product or publication to share with us as an example?  

The output results of the tool were needed by the client in KMZ (Google Earth) format, so I used skills in spatial analysis and QA/QC to ensure the KMZ file was spatially accurate and displayed properly. If the output KMZ did not look right, I used GIS/spatial analysis skills to correct the data that was input into the tool, or manually alter the tool’s output layers in GIS and re-convert to KMZ.   

Reflecting on your work, how does it align with your aspirations from when you were a student?  

Being able to contribute to advancing the field of renewable energy by working with my most recent client was certainly a step in the right direction for me — ever since I was a student I have aspired to address important social and environmental issues. I hope to take on more clients with this goal in mind, particularly for social causes as I was more human geography focused when I was in graduate school.  


This material is based upon work supported by the National Science Foundation under Grants No. 2031418, 2031407, and 2031380 (Collaborative Research: Encoding Geography – Scaling up an RPP to achieve inclusive geocomputational education). Any opinions, findings, and conclusions or recommendations expressed in this material are those of the author(s) and do not necessarily reflect the views of the National Science Foundation 


    Share

Nikolas Smilovsky

Education: Ph.D. focus on Behavioral Geography and Environmental Perception (Grand Canyon University) M.S. in Geographic Information Systems (Arizona State University), B.A. in History (University of Florida) 

The following profile was compiled by Brendan Vander Weil (Texas State University) for the Encoding Geography initiative. To learn more, visit: https://www.ncrge.org/encoding-geography/


Please describe your job, employer, and the primary tasks you perform in your position.  

I work for a technology company that primarily produces integrated global navigation satellite system (GNSS) solutions for organizations around the world. Bad Elf, LLC is a leader in the global positioning market, being one of the first companies to productize GPS devices that plug into smart devices, a new type of technology referred to as the “bring your own device” market.  As the Director of Geospatial Solutions, I specifically work with customers that have field data collection needs. I help put together best practice training sessions and solutions for their organization based on specific needs. Working with various stakeholders, I ensure success whether that is profitability, time savings, or other more altruistic goals.    

What geographic knowledge, such as terminology and concepts, is important and useful to know in your line of work?  

Having a general understanding of geographic concepts is important, because all of my customers, clients, and partners are involved with something geospatial. It is also important to understand the technology associated with geography. For example, understanding geographic information systems (GIS), computer-aided drafting and design (CADD) software, light detection and ranging (LiDAR) hardware, or unmanned aerial vehicles (UAVs) aka drones have more applicability for Bad Elf. Additionally, understanding the science and math aka geodesy, underneath the geographic concept is paramount.  

What procedural geographic knowledge, such as spatial analysis using GIS or collecting spatial data, is important for you to know?  

Being able to leverage Bad Elf data collection devices to populate geodata repositories is what we do daily. One of my roles is to support customers that have goals of collecting high fidelity field data. This data is often used in analysis and or geographic inquiry. For example, I work with universities, government agencies, national laboratories, engineering firms, environmental consultants, land surveyors, biologists, planners, arborists, and architects who all do some type of procedural geographic tasks.     

Can you provide an example of a project where you apply geography and computer science to analyze and solve problems related to important issues? 

While I don’t often directly deal with solving important end-game issues, I do help the people that are breaking industry chains and are doing significant research/application. In a sense, I get to support the efforts intrinsically through my support. What is also extremely important to me, is that I get to help a wide plethora of people do better geography. Every day I get to help a different industry, organization, or even country tackle their specific geospatial conundrums.    

What types of geographic questions do you ask and think about in your work? 

I deal with every type of individual, organization, or entity that completes geospatial field data collection. The amount of technology and science that we work with and integrate is expansive. If you don’t have good geospatial data, you won’t complete good work. Thus, I ensure my customers can collect amazing, authoritative data so that they can perform their downstream tasks more efficiently and confidently. I may not get all the glory for completing these projects, but that is not important. What is important is being able to collect good data!   

What types of data did you acquire to support your work?  

Our GPS devices natively collect latitudinal, longitudinal, and elevational values, along with geodetic metadata associated with the acquisition of the spatial coordinates. Additionally, our devices are integrated into utility locators, which detect underground systems of infrastructure; laser rangefinders that help collect offset locations like tree heights; and most drones/LiDAR systems which collect remotely sense data like aerial imagery, point clouds, radiation, and non-visible light spectrums, and temperature.   

What types of knowledge and skills, both geographic and general, do you use to evaluate, process, and analyze the data you gather for your work? 

Mostly GIS software packages like Esri ArcGIS Pro or Q-GIS are used to evaluate the data procured by the Bad Elf devices. Additionally CAD programs like AutoCAD Civil 3D and BIM programs like Revit are used for modeling purposes. Additionally, we use computer programing languages like Python to manipulate the data.   

How do you communicate the results of your work? Do you have a recent product or publication to share with us as an example?  

We mostly make quantitative maps and spreadsheets showing our data and how they compare to other datasets. Our clients use hundreds of different methods and applications to complete this process. A perfect example of a customer using Bad Elf, Esri, Go Pro Cameras, tablets, and e-bikes to collect utility data is this case study from the town of Cave Creek, Ariz. 

How do you view your work in relation to civic engagement and issues that you care about?  

I engage daily with both the private and public sectors of our society so that they can better complete the tasks they set out to do. I eat, sleep, and dream geospatial. Every day that I get to engage in helping people do better spatial tasks is a great day.  

How does your career align with your values and aspirations in life now and back when you were a student?  

I feel very blessed because my employer and my values align extremely well. Aligning well with your organization is extremely important for your happiness and growth, but also for the organization to be successful. My father always said, “Nik you will eat a lot in your life, so enjoy your food. You will also sleep a lot, so enjoy your bed. Lastly you will work the most, so make sure you love your job!”  


This material is based upon work supported by the National Science Foundation under Grants No. 2031418, 2031407, and 2031380 (Collaborative Research: Encoding Geography – Scaling up an RPP to achieve inclusive geocomputational education). Any opinions, findings, and conclusions or recommendations expressed in this material are those of the author(s) and do not necessarily reflect the views of the National Science Foundation 


    Share

Locating Ourselves, and Our Purpose, in Time

Mesoscale convective vortex over Brazil. Credit: NASA
Credit: NASA

Toward a Brighter Post-Pandemic World 

Photo of Marilyn Raphael by Ashley Kruythoff, UCLA

I begin this year of my presidency feeling thankful. Thankful that I survived the pandemic (so far!) and thankful for the opportunity to serve my discipline at this level. So, before I write another word, I want to say thank you for giving me this opportunity. I did not imagine, indeed, could never have imagined becoming president of this Association when as a child my interest in geography began to develop. I am looking forward to working with the Council on matters of importance to geography and to the members of the AAG. I am looking forward to going to the regional meetings this fall and doing my part to support and encourage the work that the regions are doing. I firmly believe that as its regional divisions thrive, so will the whole Association.  

In this column, I’ll focus on the effect of the pandemic on us. I want to acknowledge here our three previous presidents who served their terms under the shadow of COVID-19, as well as our Executive Director Gary Langham who has only known the AAG during the pandemic. David Kaplan was there in March 2020, just as these changes had begun, writing a compassionate column warning of the threat, pointing out how well positioned geography is to help us understand the threat, and asking us to be careful ourselves and to look out for others. Amy Lobben served her term completely virtually, and Emily Yeh’s term was almost completely virtual. Their stewardship has meant that the AAG has not only survived the pandemic, but seized opportunities to re-envision its service to members.   

I’m beginning my presidency at a peculiar time in the AAG’s history. For the past two and a half years we’ve been living with a pandemic, forced by the extremely contagious novel coronavirus – COVID-19. This virus and our response to it have changed the way we live and work, the economy, and society, in fundamental ways, some of which we will only recognize in coming years. And these changes are not limited to the US. They are worldwide.   

Emergence from the pandemic has not been a smooth transition back to normal, probably because that pre-2020 normal does not exist anymore. We are now in what some call a new normal, and others the post-pandemic world. I wonder, is it true that we are post—pandemic, and if it is, what exactly does that mean? How has this experience changed what and how we think, as well as how we live our lives? How much of that change is good? How much of it do we need to undo? What has not changed and needs to change? What has changed but not enough, so that we still need to work on it? What has changed that we need to keep in its new form? I have a lot of questions.   

Emergence from the pandemic has not been a smooth transition back to normal, probably because that pre-2020 normal does not exist anymore.

Over the course of the last two and a half years I have been actively looking at these changes with the express aim of seeing what good I could extract. One might say, actively trying to find the silver lining in the mesoscale convective complex that is COVID-19. It is not an easy task, but I did not want to emerge from the pandemic with nothing positive to show for all of the chaos that it caused. Here is some of what I found. 

COVID-19 separated us from each other. Our first response to the virus was to isolate ourselves, either due to official lockdowns or by choice and concern. In that justifiable fear for our lives before vaccines became freely available, we withdrew, stayed home, worked from home, attended classes from home, and tried to play at home. For many of us this was fine. We took the opportunity to focus on family life, DIY projects abounded, selfcare ascended as a vital approach to our days. For many of us, though, the lockdown phase of the pandemic was hugely problematic. Many people could not stay home or lost their jobs because employers depended on us to show up, but we withdrew. Trying to work/teach/host/attend meetings online from an active home was difficult, sometimes embarrassing. And yes, sometimes, that home to which we withdrew was not a safe space. My silver lining (and I realized later, that of many others) is the weekly family Zoom meetings that my brother instituted. We are a large family living in several countries, thousands of miles apart from each other and we had the real fear that isolation forced by Covid would destroy our connectedness. The weekly Zoom meetings have helped to keep us connected even more tightly than we were before the pandemic began.   

What has changed that we need to keep in its new form?  What has changed but not enough so that we still need to work on it?  

We changed how we travelled and communicated. We greatly limited airplane travel and drove fewer miles, especially those who stopped commuting to work. Texts and phone calls and social media were no longer backed up by in-person social events or the daily meetings and conversations at work. Our annual meetings, where we met our colleagues, renewed friendships and collaborations, and shared our research, went virtual. And, despite the heroic attempts of our tech people, virtual spaces cannot compare to in-person for maintaining those vital connections. One—alas temporary—silver lining here was an immediate and significant effect on the levels of atmospheric pollution in major cities around the globe. In Los Angeles, where I “isolated” I have never seen such brilliantly blue skies except perhaps the day after a storm passed over. The pandemic showed us that we could substantially cut emissions of greenhouse gases if we were forced to. Another, more enduring, silver lining here is that as we are emerging from the crisis and able to again meet in person, we have also learned the value—especially for cost, and access—of maintaining a virtual option.   

COVID-19 negatively affected our academic units. One of my tasks as Vice President was to organize and host the Departmental Chairs’ Luncheon. As a part of preparing for the discussion, the group was polled for topics of interest. Advice on how to deal with the negative impacts of COVID-19 on their departments was the topic most often mentioned. Their concerns ranged from work overload and burnout to low faculty morale and the fear that the pandemic had forced structural changes, often bringing student and faculty and staff expectations into conflict. These underscored for me how negatively affected we have been by the pandemic and the urgent need to take steps to support our faculty and students in the wake of the pandemic. But the discussion around these issues also revealed to me how strong the desire is to come through this safely and to use what we have learnt to make stronger, more caring departments and indeed a stronger and more caring AAG. It is an opportunity for the AAG to become more relevant to its membership and to the broader community as we emerge from the pandemic.   

Changing For Good

This year as President I want to focus on bringing AAG to a sustainable post-pandemic state. I want us to take advantage of the new opportunities that have developed over the past two and a half years. I begin in this column by addressing a couple of the questions that I raised earlier.   

What has changed that we need to keep in its new form? 

My answer here would be our approach to communicating. For example, there are ways we can improve the experience of virtual meetings at AAG. We do not have to completely sacrifice our annual in-person meeting; however, we should continue to expand and improve our virtual (and hybrid) capacity to provide thoughtful and well-executed options for participation. AAG is already providing new yearlong opportunities for us to engage with each other through Professional Development webinars for leaders and early-career geographers, as well as the Summer Series specifically for students. I can foresee membership growth with simultaneous reduced carbon footprint from this win-win approach. 

What has changed but not enough so that we still need to work on it?  

There are other answers here, but I will say that our awareness of inequality has heightened, supporting actions that were already started within the AAG. It is no coincidence that some of AAG’s most valuable programming under the Rapid Response to COVID-19–for example, Bridging the Digital Divide and the equity and mental health aspects of the Graduate Summer Series–were also meant to address longstanding inequities within the geography discipline, itself a mirror of inequities in society. As I said in my nomination statement for this presidency, COVID-19 brought these inequities into more prominence: “The legitimate fear of infection has led to an abrupt change in the way in which society operates and communicates, exposing the realities of our inequality.” While the trio of diversity, inclusion, and representation has been a focus in the AAG, it remains a critical issue, and AAG still has work to do to ensure that geography as a discipline becomes inclusive and equitable. We need to continue to work on reducing inequality and to address racial, social and environmental injustice, in our discipline. And the way to do this is through increased diversity, inclusion and representation of under-represented groups. I was excited to read the JEDI framework document and look forward to the implementation of its recommendations.   

The way ahead. The pandemic was/is a disruption of immense proportions. However, we geographers are a resilient bunch and because of this we will extract from this experience the pieces that will help us shape ourselves into a bigger/better/stronger organization. We will emerge and thrive, becoming really post-pandemic. I look forward to helping us get there.  

DOI: 10.14433/2017.0111


Please note: The ideas expressed in the AAG President’s column are not necessarily the views of the AAG as a whole. This column is traditionally a space in which the president may talk about their views or focus during their tenure as president of AAG, or spotlight their areas of professional work. Please feel free to email the president directly at raphael [at] geog [dot] ucla [dot] edu to enable a constructive discussion. 

    Share

Resources for Climate Action

Screenshot of statistics and impacts of drought in the U.S. as mapped in Esri ArcGIS Drought Aware map

This piece by Esri’s Global Education Manager Michael Gould is part of a series of sponsored articles from Esri.


Esri offers a huge collection of resources related to climate and sustainability topics. In 2022 we will publish a collection of learning/teaching resources to help non-climate-specialists at universities (primarily) to introduce climate action topics into their classroom or research activities, with a focus on solutions and opportunities to take action.

Resource Categories

The climate action resource collection is destined to find a home in Esri’s Climate Portal and be composed of packages many of which will include:

  • Datasets, covering physical and social phenomena
  • ArcGIS Learn lesson(s)
  • A StoryMap that sets the stage and provide context to each topic
  • In some cases, lightweb web applications to use when a full GIS implementation is not a requirement.

In order to maximize the general benefit of these resources we are working with collaborators from universities and partner organizations. Some collaborators provide use cases, others subject matter expertise, datasets, and/or frameworks that we can add value to via GIS workflows. One such framework is the collection of Climate Solutions from Project Drawdown. These include topics such as carpooling, bicycle infrastructure, and tree plantation. How can we use ArcGIS to make concrete and quantitative contributions towards those solutions?

Esri has a long track record working on environmental and climate related projects, and a few years back we started hosting a huge collection –hundreds of themes or layers– of curated geographic information: the ArcGIS Living Atlas of the World. Many other Esri resources now draw on that rich data source, and we anticipate that your workflows, classroom exercises, and research projects will do likewise. Not only do you have access to Esri-created data but also to data contributed by collaborators around the world: agencies such as NASA, NOAA, Census, cities and local governments, and commercial partners. You can nominate your own datasets –research results for example– for inclusion in the Living Atlas and the content will be automatically checked for metadata completeness and other measures, and then be human-checked and curated by Esri’s subject matter experts. Once included the dataset is hosted by Esri and made available to GIS users around the world.

In this post, I’ll walk through two scenarios for using these resources to investigate climate issues and developing action plans.

Extreme Drought

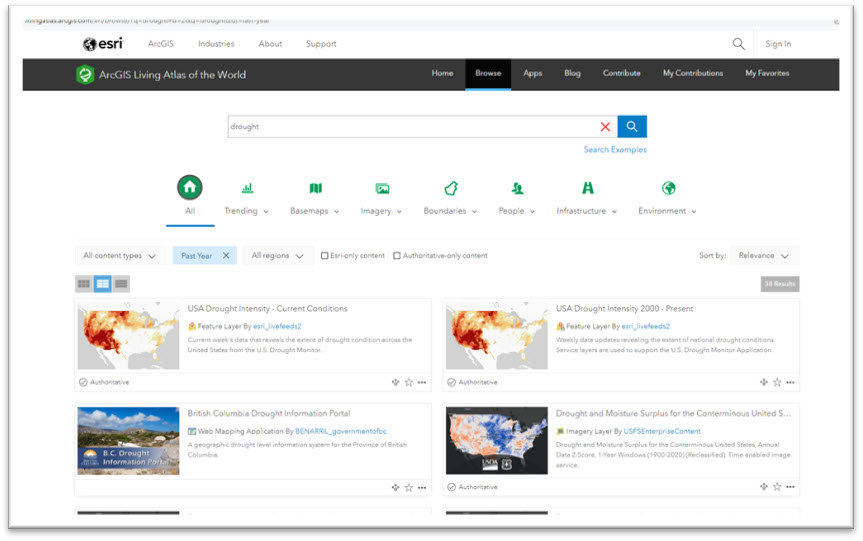
When we search the Atlas on the keyword “climate” and filter on data only from the past year, we find 391 (at the time of this writing) related resources. Try for yourself and experience the diversity of topics, geographical extents, and data contributors.

Try other related keywords too, for example environment or drought. The latter points us to NOAA-provided data feeds for the USA, for example US Drought Intensity—Current Conditions which is “live” data updated weekly.

A screenshot of the ArcGIS Living Atlas of the World website
Figure 1. ArcGIS Living Atlas of the World.


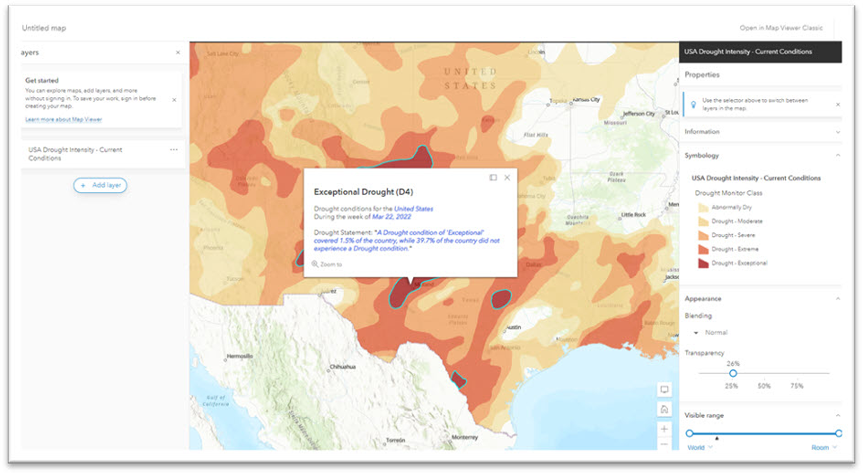
A screenshot of a map of drought intensity in the United States
Figure 2. A map of drought intensity in the United States.


This is just one of many examples of up-to-date, climate-oriented data that have been symbolized, pop-ups configured, and made available for your classroom or research projects to be combined with socioeconomic data sources in order to determine who is affected, for example.

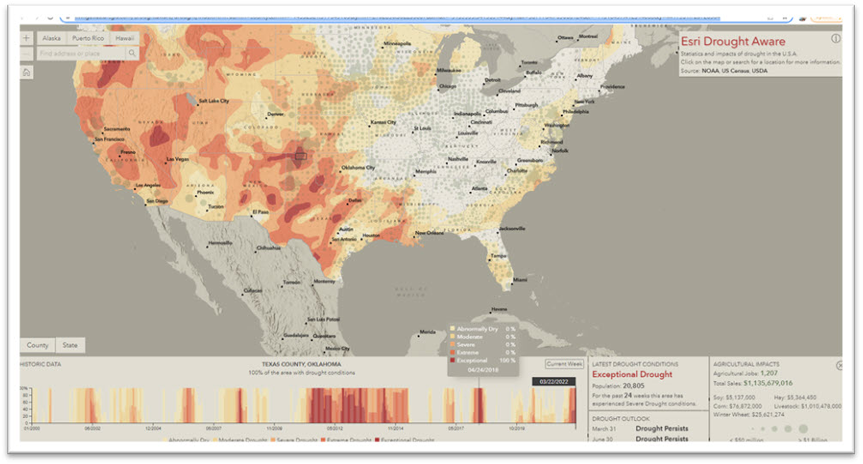
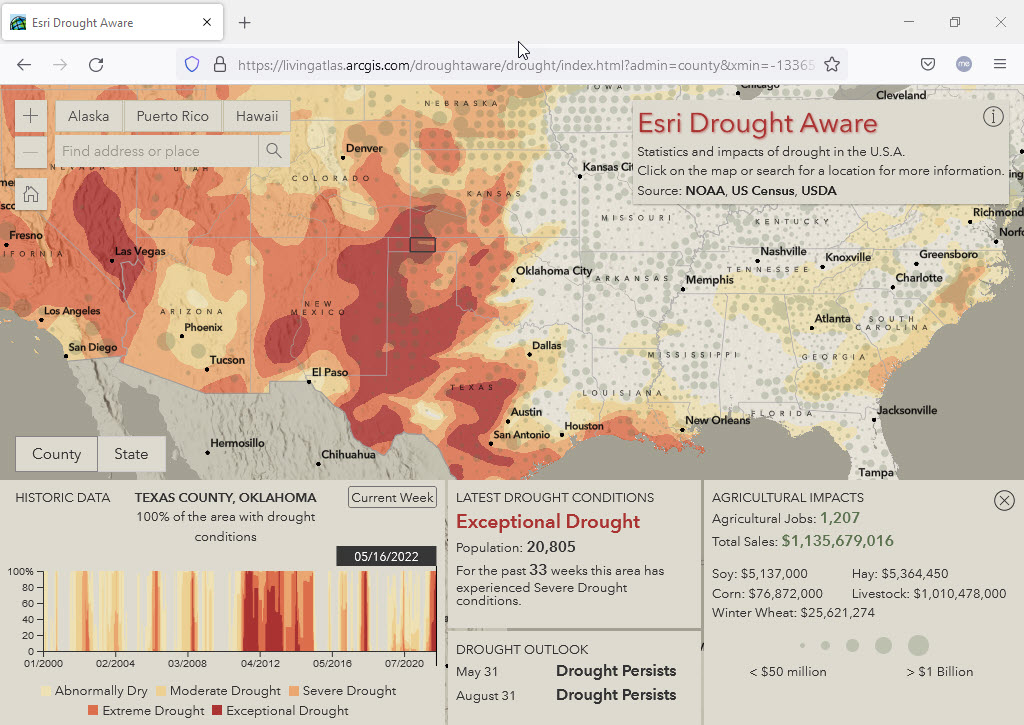
This live-feed feature layer could be used in ArcGIS Pro or the ArcGIS Online Map Viewer, but in this case, it is the basis of the Drought Aware web application that is also hosted on the Living Atlas. In addition to drought data, this app includes layers from the US Census American Community Survey and from the US Department of Agriculture. In the image below, we selected a county in the Oklahoma panhandle and the application queried the drought and underlying census and agricultural data layers to show several indicators below in dashboard style. Texas County, Oklahoma is in a period of extreme drought. While the population is modest (20,000 inhabitants), over $1 Billion of agricultural sales are affected, mostly livestock. Also at the bottom is a time series for that selected county, and we can click on the graph to see drought conditions at any period going back to 2000 (April 2018 selected in this image).

Screenshot of the Drought Aware web app
Figure 3. The Drought Aware app showing historic trends, current conditions, and impacts of drought in the United States.


For more information about the contents and use of the Drought Aware application, one of several thematic “Aware” apps, see creator Dan Pisut’s blog post.

Sea Level Rise

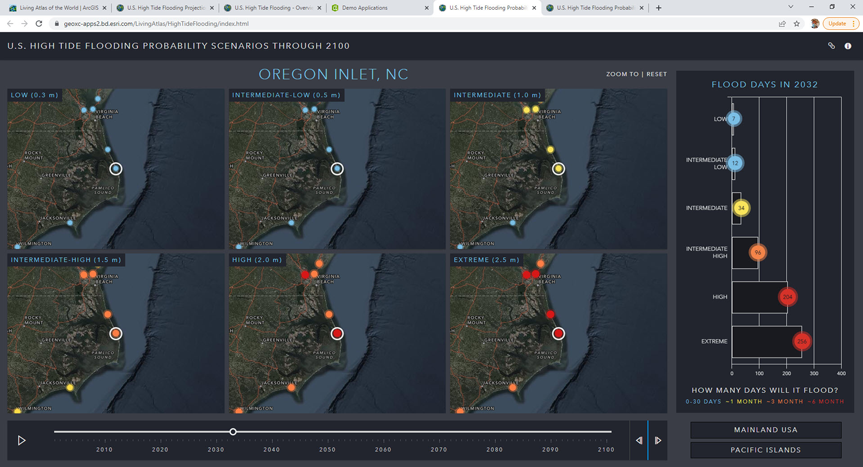
Another climate related issue that can be investigated with GIS is sea level rise, starting with a High Tide Flooding Scenarios dataset also from NOAA. Again that data layer could be used alone, but is included in a web app that compares several flooding scenario predictions through the year 2100. We selected Oregon Inlet, North Carolina, and from the Intermediate flooding model (assuming 1 meter sea level rise) it shows that “sunny day” flooding events would go from 13 (2022) to 34 (2032) days per year. And that’s just in the coming decade and for the fairly conservative Intermediate model: it could be much worse. Try the app for yourself: have a look at the Gulf of Mexico near New Orleans or Houston for example.

Screenshot of maps showing flooding probability
Figure 4. High Tide Flooding Probability Scenarios.


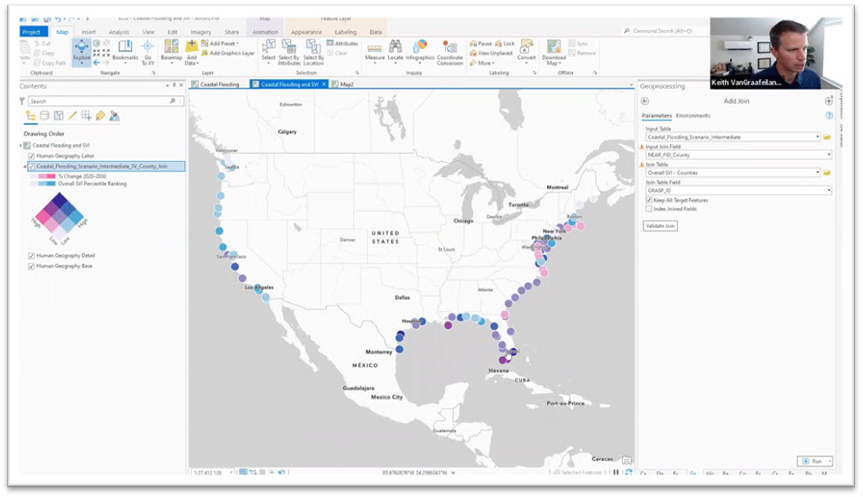
Now, just as with the drought dataset, we can repeat the process known as geo-enrichment to add sociodemographic layers and then drill into specific flooding areas to ask who is or would be affected. We could open the flooding scenarios layer in ArcGIS Pro, select Intermediate, experiment with the time slider, manipulate symbology, and then we can join the CDC Social Vulnerability Index (SVI) 2018 data. SVI data are composed of 15 social factors in 4 themes: Socioeconomic, Housing composition and disability, Minority status and language, and Housing and transportation.

The spatial join used the nearest feature and a 1 Km radius, to create a bivariate map showing percent change in flooding risk and SVI score (see the cube with cyan and magenta symbology) of each location. Colors tending toward purple in the cube indicate high vulnerability.

Screenshot of map showing potential impact of flooding on vulnerable populations
Figure 5. Potential impact of coastal flooding on vulnerable populations.


For more information on this flooding scenario, see this blog post by Keith VanGraafeiland. The javascript code for the High Tide app is available on github.

Create your Own

These are just two examples of climate action workflows that help to help bring home the message of dangerous climate-related phenomena that affect certain populations in certain locations, now and in the future. We encourage you to join us in creating new exercises as part of the Climate Action resource collection, so that other instructors, learners, and researchers can analyze geographic data from their desktop GIS, Map Viewer, or web application. Let’s show the world how GIS can make concrete contributions to climate resilience.

    Share

Brent Sams

Education: Ph.D. in Horticulture (University of Adelaide), Master of Geography (Virginia Tech), B.S. in Geography (University of North Alabama)  

The following profile was compiled by Brendan Vander Weil (Texas State University) for the Encoding Geography initiative. To learn more, visit: https://www.ncrge.org/encoding-geography/ 


Describe your job, employer, and the primary tasks you perform in your position.  

My current role as a Viticulture Research Scientist at E&J Gallo Winery is to design and execute research projects focused on understanding how fruit chemistry/quality change over time and space. I am interested in these changes from the within-vineyard scale to the regional scale. To accomplish this, I (with a lot of help from others) use a wide variety of field measurements (fruit zone light exposure, vine canopy temperature, soil cores, and many others), proximal sensing (electric conductivity, elevation mapping), and remote sensing (satellite, UAV, commercial aircraft). I spend a good deal of time analyzing how these measurements are connected.  

How has your education/background in geography prepared you for this position? 

The interaction of geography and computer science is essential for my role, along with many others in my department. At the project level, I work with different types of datasets that must be organized so that they can be analyzed and interpreted together. I rarely start any of this in GIS, but in a statistics package/program. I don’t have a background in computer science or coding/programming, but these have been very useful skills to develop. Once I have a product/model/application, it needs to be available for use by our stakeholders. This can be a dashboard, a database, or other digestible format which usually implies additional knowledge of other programs or applications. Probably the most specific use of geo-computation in my role is in the geostatistical analyses of grape samples collected from different densities and locations.  

What is an example of applying geography concepts and skills in order to analyze and solve problems in your work? 

Recently, we’ve been working on a project to combine data from multiple vineyards to add statistical robustness to the spatial analysis of low-density grape samples. To validate the method, we divided up the vineyards into fishnet grids to create a Monte Carlo simulation that would iterate through many different combinations of field samples based on their locations.  

What types of geographic questions did you ask and think about in your project? 

We were interested in how wine grape chemistry changed over time and space, and at specific locations from the within-vineyard scale to the regional or statewide scale; how farm management and the environment are connected; and how we could use all of these variables to make predictions about where to find the best fruit. All this information needed to be synthesized and made into something that could be analyzed by a computer. Sometimes in the quantitative analysis world we are faced with qualitative variables and how to incorporate things like, “How does this vineyard manager decide when and how much water to irrigate?.” These then need to be summarized into something we can include in a mathematical model.   

What types of data did you acquire to support your project?  

For this project, we were mostly interested in the chemistry of grapes processed in a lab after the sample location was tagged with a GPS unit. In a related project and at the same locations, we measured soil texture, the fraction of useful light into the fruit zone of the canopy, and yield.  

What types of content knowledge and skills (both geographic and more general) did you use to evaluate, process, and analyze the data you gathered for your project? 

Everything starts with the synthesis of what’s been done, where, and how. Experimental design and sampling strategies are also necessary. There are a lot of measurements specific to grapevines that we used, but general statistical knowledge was also necessary for writing reports, publications, etc. I use R and R Studio quite a bit, as well as several GIS applications with a bunch of different spatial analyses. One specific example is the use of k-means classification with raster datasets to assess patterns that exist between different layers such as interpolated chemistry maps with soil maps or imagery.   

How did you communicate the results of your project (e.g., writing technical reports, making maps and geo-visualizations, creating graphics, data tables, etc.)? Do you have a recent product or publication to share with us as an example?  

There will be a few publications from this data set, as well as reports to internal stakeholders. You can find those publications below:   

  • Sams, B., Bramley, R.G.V., Sanchez, L., Dokoozlian, N.K., Ford, C.M., and Pagay, V. (2022) Remote sensing, yield, physical characteristics, and fruit composition variability in Cabernet Sauvignon vineyards. American Journal of Enology and Viticulture 73, 93-105. 
  • Sams, B., Bramley, R., Sanchez, L., Dokoozlian, N., Ford, C. and Pagay, V. (2022) Characterising spatio-temporal variation in fruit composition for improved winegrowing management in California Cabernet Sauvignon. Australian Journal of Grape and Wine Research. https://doi.org/10.1111/ajgw.12542 
  • Sams, B., Bramley, R., Aboutalebi, M., Sanchez, L., Dokoozlian, N.K., Ford, C.M. and Pagay, V. (2022) Facilitating mapping and understanding of within-vineyard variation in fruit composition using data pooled from multiple vineyards. Australian Journal of Grape and Wine Research. https://doi.org/10.1111/ajgw.12556 

What are the criteria that you use to assess the quality of your results?  

I’m an applied researcher in the private sector, so while the publications are nice, I really want to know if something works. Does it help us do something, save us money, or even make us more money?


This material is based upon work supported by the National Science Foundation under Grants No. 2031418, 2031407, and 2031380 (Collaborative Research: Encoding Geography – Scaling up an RPP to achieve inclusive geocomputational education). Any opinions, findings, and conclusions or recommendations expressed in this material are those of the author(s) and do not necessarily reflect the views of the National Science Foundation 


    Share

Suparna Das

Education: Ph.D. in Geography (University of Utah), M.A. in Regional Planning and Development (Jawaharlal Nehru University), B.S. in Geography (University of Calcutta) 

The following profile was compiled by Brendan Vander Weil (Texas State University) for the Encoding Geography initiative. To learn more, visit: https://www.ncrge.org/encoding-geography/


Please describe your job, employer, and the primary tasks you perform in your position.  

I’m currently responsible for supervising an expanding group of talented statisticians, behavioral health scientists, data analysts and epidemiologists. Together we manage data collection efforts, disseminate various products (reports, publications, briefings, policy documents) and advise behavioral health policies for the administration. The Treatment Services Branch (TSB) is responsible for three major behavioral health data collection and surveillance systems: Drug Abuse Warning Network (DAWN) and Behavioral Health Information Surveillance Systems (BHSIS) and provide all statistical support for Buprenorphine Waiver Notification Systems (BWNS).  

Before joining SAMHSA in March 2021, for close to seven years I was working as the statistician and viral hepatitis epidemiologist for DC Department of Health (DOH). I was also part of the COVID-19 Task force for DC from 2020–2021. 

How has your education/background in geography prepared you for this position? 

Geo-computation, from my understanding, is the “art and science of solving complex geographical (spatial) problems through computation” (Source unknown). I want to take this opportunity to iterate that Geographical Information Systems (GIS) and Geographical Information Sciences (GISc) are NOT interchangeable. I strongly believe that we as geographers can do a lot more than make maps. This belief has been the central tenet of my career in public service. We can assist decision-making in the most scientific method with our understanding of space and spatial changes over time.   

As a graduate student in India (Jawaharlal Nehru University (JNU)) and the U.S. (University of Utah), I was lucky to have received extensive training as a spatial scientist and demographer. This expanded my understanding of population sciences and geo-computation, which I apply every day in my position to improve health outcomes for people. 

What is an example of applying geography concepts and skills in order to analyze and solve problems in your work? 

I have several projects that are currently being implemented where I am using geo-computational methodologies, but we will have to wait for them to be released through SAMHSA. For me, it is impossible to resolve mental health and substance abuse disparities and encourage health equity without spatial thinking and geo-computation. SAMHSA (specially CBHSQ) understands that and encourages discussion on applying geo-computation while also supporting and encouraging researchers to use https://findtreatment.samhsa.gov/ for analytical and geo-computational purposes, among many other projects.  

From my previous position at DC DOH, where I spent close to seven years, I was able to implement several geo-computational projects. I published as much as I could to make sure people knew about administrative data collection and the impact of geo-computation in policy. One project example is DC’s effort to End the HIV Epidemic (EHE).  

I was proud to have been an integral part of the EHE implementation with the DC DOH, which has achieved the first of its 90/90/90 goals (https://www.dcendshiv.org/) of 90% of people living with HIV being aware of their HIV status (and now aiming for 95%). We were committed to implementing evidence-based policies to improve care for people living with HIV and create access to prevention and tools to stop new infections.   

I used spatial analysis to find high-risk areas that needed immediate attention, resource re-allocation, and Pre-Exposure Prophylaxis (PrEP) to reach the EHE goals. I was responsible for monitoring and evaluation (M&E) of Centers for Disease Control and Prevention’s Social Network Strategy (SNS) to identify new HIV diagnoses for DC.  

For M&E, I was responsible for programmatic data collection, program monitoring, evaluating the programs and the outcomes, providing technical support and assisting in resource allocation. I then mapped the outcomes for the community-based organizations (CBOs) for improvements. The project was instrumental to a separate proposal for using geolocation-based applications to identify new HIV diagnoses for states to implement.  

What types of geographic questions did you ask and think about in your project? 

My questions as a public servant always have a two-tier approach:  

In the first tier: What is the impact of my project on the lives of people and what outcome do I want to answer through this project. I restrict my projects to non-exploratory but policy-oriented questions.  

In the second tier: My projects span demography, GISc and spatial epidemiology or health geography. I do not have any projects or have been part of any project that does/did not entail extensive statistical/data management-based coding.  

What types of data did you acquire to support your project?  

I always use administrative data collection for my projects within my role as a public servant. These data collection tools inform policies within the administration. I encourage researchers in academic settings to use them as well. There are several administrative data sets available which can be instrumental in framing accurate questions. I also encourage researchers to read annual reports to understand their needs. SAMHSA has several such data collection efforts which are publicly available through public use files https://www.samhsa.gov/data/ 

What types of content knowledge and skills (both geographic and more general) did you use to evaluate, process, and analyze the data you gathered for your project? 

A large part of my job is to make sure that administrative data is collected without any glitches and plan how to enhance data collection so that it will assist health related policies in the United States. The scope of each ongoing project is different, thus, as a supervisor, my job is to assign it to the appropriate subject matter expert (SME) who would be responsible to evaluate, process and analyze the data.  

As for projects that I take interest in, they are ones that have a large spatio-temporal aspect to it or have predictive capacity.  

How did you communicate the results of your project (e.g., writing technical reports, making maps and geo-visualizations, creating graphics, data tables, etc.)? Do you have a recent product or publication to share with us as an example?  

I have communicated my results to multiple stakeholders, ranging from scientific audiences, panels, political stakeholders, community-based organizations, legal groups, media (including interviews), administrative leaderships, and the public. The communication strategies I use differ based on the audience. I have generated reports, technical documentation, maps for program evaluation for resource allocation, publications, and conference proceedings.  

What are the criteria that you use to assess the quality of your results?  

I look at the impact of my project on improving health outcomes for people and its scientific validity – in other words, I’m looking at the impact of my results on implementing evidence-based policy. 


This material is based upon work supported by the National Science Foundation under Grants No. 2031418, 2031407, and 2031380 (Collaborative Research: Encoding Geography – Scaling up an RPP to achieve inclusive geocomputational education). Any opinions, findings, and conclusions or recommendations expressed in this material are those of the author(s) and do not necessarily reflect the views of the National Science Foundation 


    Share