Rebecca Grover

Education: M.A. in Geography (San Diego State University) B.A. in Geography, English (University of Vermont)

The following profile was compiled by Brendan Vander Weil (Texas State University) for the Encoding Geography initiative. To learn more, visit: https://www.ncrge.org/encoding-geography/


Please describe your job, employer, and the primary tasks you perform in your position.  

I am self-employed as a GIS analyst and consultant. In this position, I perform a wide variety of tasks to solve analytical problems and provide GIS solutions to clients. Most recently, I provided GIS support for a renewable energy development company. In this role, I ran and maintained a customized tool to extract land that would be suitable for solar energy development. I also provided customized GIS analyses, including a process for displaying areas of neighboring landowners with large acreages of land for potential solar development outreach. I also spent much time searching for and compiling data, such as parcels and endangered species and maintaining a variety of geodatabases for running tools and processes.   

What geographic knowledge, such as terminology and concepts, is important and useful to know in your line of work?   

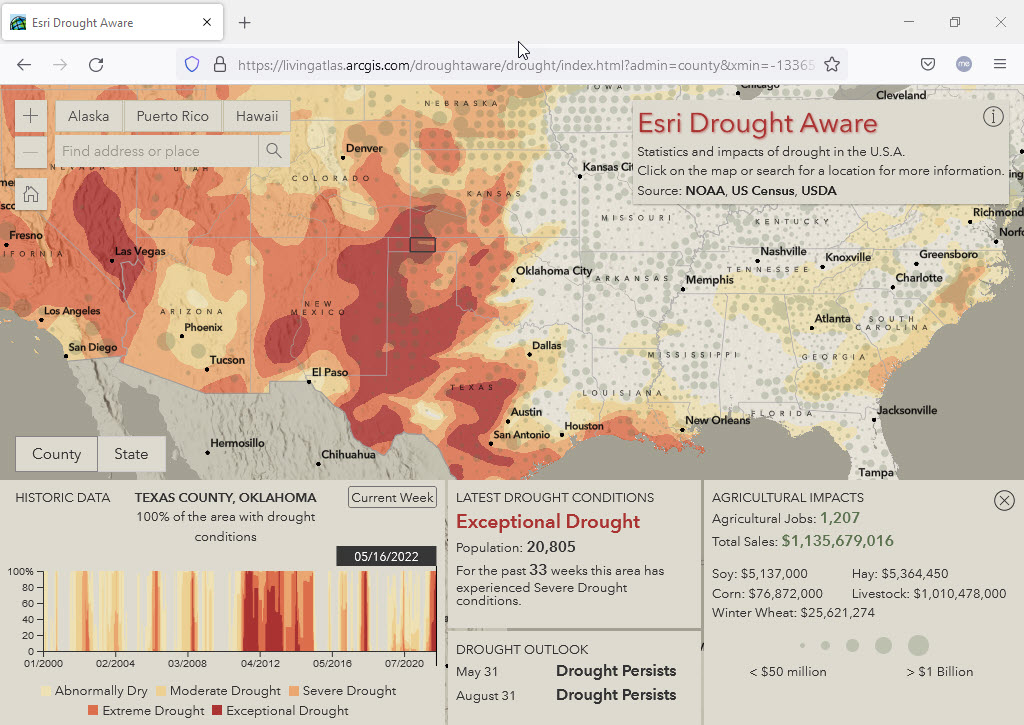
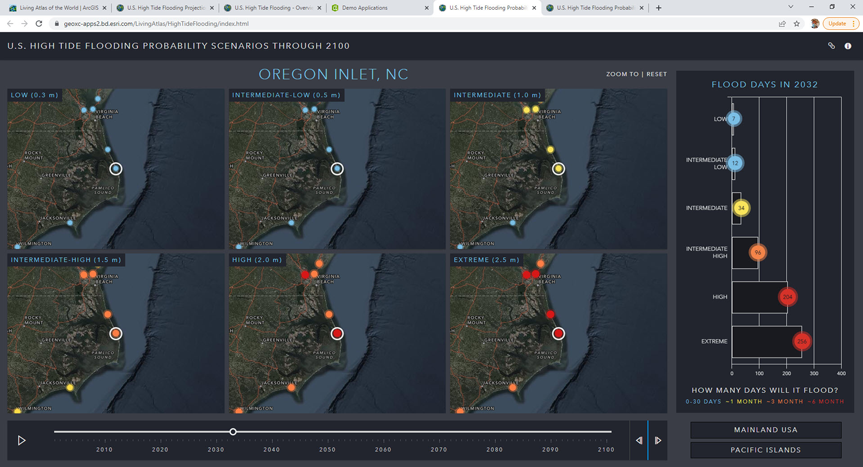
For a recent client, it was beneficial to know basic physical geography concepts such as the definition of a 100-year flood zone, and knowledge of other FEMA-related data and concepts. In addition, understanding how parcel data is assessed and attributed was important to know as well as basic knowledge of environmental geography, such as state-listed versus federally-listed endangered species.   

What conceptual geographic knowledge is important and useful to know?   

For one renewable energy client, there was a significant element of interconnection and the importance of place as it related to the natural environment. Many different factors – such as the location of land, any constraints on the land, ownership of neighboring land, and governance of land – contributed to identifying potential sites for developing solar energy. Both general knowledge of how location is important to this work, as well as knowledge of environmental considerations, were useful to know.   

What procedural geographic knowledge is important and use to know?  

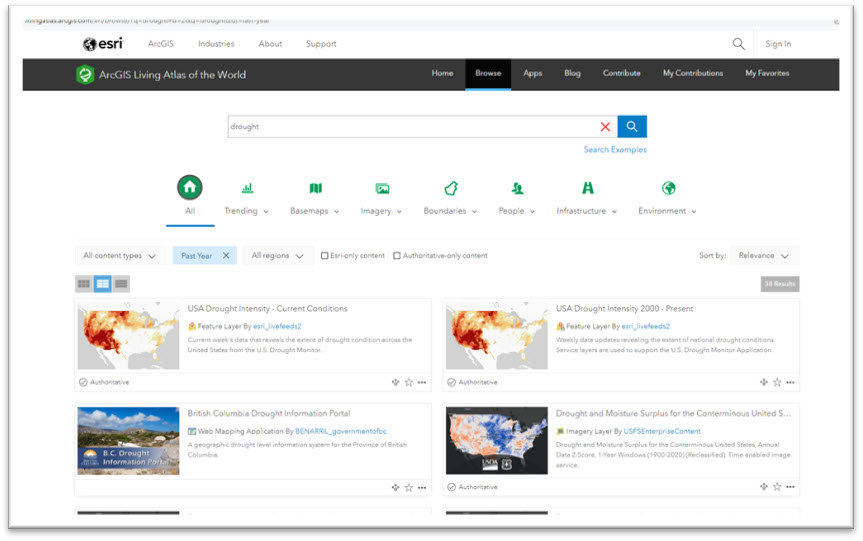
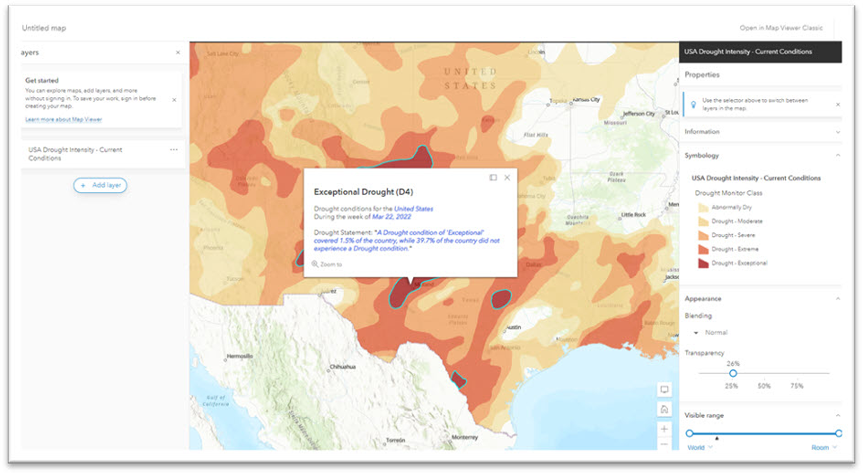
Knowing GIS and spatial analysis methods was crucial to performing this work as a GIS Analyst. Also, understanding where to look for downloadable spatial data and managing and interpreting said data was key to this role. Having a solid grasp of geoprocessing methods and procedures was also essential, as well as quality-checking and analyzing the results.    

What areas of computer science are important and useful to know?  

Definitely basic computer programming — such as Python (which is used with GIS).   

Can you provide an example of a project where you apply geography and computer science to analyze and solve problems related to important issues? 

For my most recent client, we were constantly looking for new land on which to develop solar energy. Therefore, one of my most common tasks was to run and maintain a customized tool in GIS to extract this developable land – the first step in assessing where to build solar and promote the advancement of renewables.   

What types of geographic questions did you ask and think about in your project?  

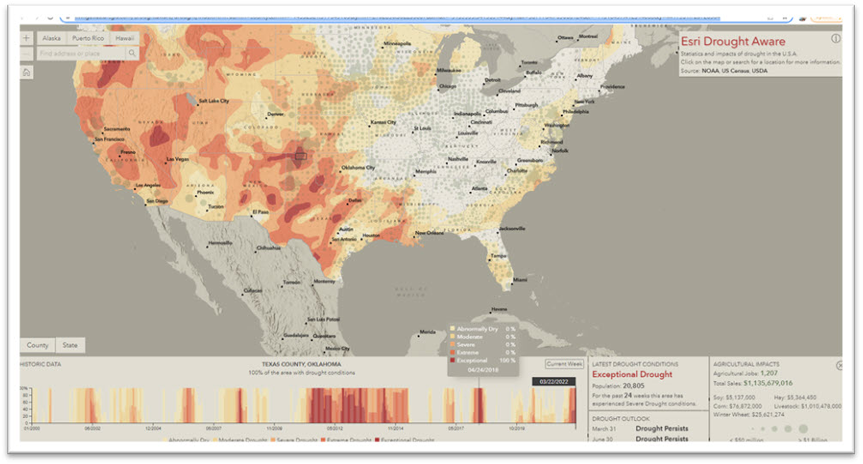
Before running the tool, I needed to ensure that the databases that the tool would connect to and iterate through were in the right location with the right datasets. The first question was, are the databases ready, and is all my data there? Next, if there was an error with the tool, I had to discover where the issue was and ask myself whether it was a data issue, a server connection issue, or something else. And when the tool finished running, I needed to examine the output and ask myself if the results made sense – did the flood zone and wetland layers appear to show correctly? Did the developable land align in a sensical way and did not overlap with the constraints layers? Were any data layers missing?   

What types of data did you acquire to support your project?  

I acquired many types of data for my project, with the following being the most critical: 

  • DEM tiles from USGS 
  • 100-year flood zone FEMA data 
  • Wetlands data from FWS 

What types of knowledge and skills, both geographic and general, do you use to evaluate, process, and analyze the data you gather for your work? 

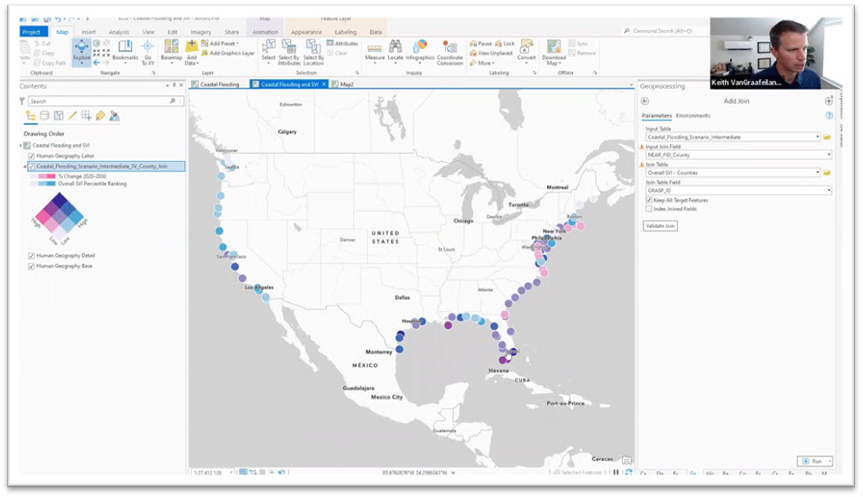
I used my prior knowledge of working with DEMs and the Spatial Analyst extension to effectively download and organize DEM tiles from the USGS site and analyze the resulting slope data. For the 100-year flood zone data from FEMA, I used geoprocessing skills such as extracting data by attribute and exporting data between databases to process and organize the data to be ready for use in the tool. I used similar techniques to prepare the wetlands data. To analyze the output of the tool, I used a variety of content knowledge/skills like interpreting aerial imagery, quality checking spatial and attribute data for accuracy, and problem-solving/error tracking if something did not look right.   

How did you apply geography to communicate the results of your project? Do you have a recent product or publication to share with us as an example?  

The output results of the tool were needed by the client in KMZ (Google Earth) format, so I used skills in spatial analysis and QA/QC to ensure the KMZ file was spatially accurate and displayed properly. If the output KMZ did not look right, I used GIS/spatial analysis skills to correct the data that was input into the tool, or manually alter the tool’s output layers in GIS and re-convert to KMZ.   

Reflecting on your work, how does it align with your aspirations from when you were a student?  

Being able to contribute to advancing the field of renewable energy by working with my most recent client was certainly a step in the right direction for me — ever since I was a student I have aspired to address important social and environmental issues. I hope to take on more clients with this goal in mind, particularly for social causes as I was more human geography focused when I was in graduate school.  


This material is based upon work supported by the National Science Foundation under Grants No. 2031418, 2031407, and 2031380 (Collaborative Research: Encoding Geography – Scaling up an RPP to achieve inclusive geocomputational education). Any opinions, findings, and conclusions or recommendations expressed in this material are those of the author(s) and do not necessarily reflect the views of the National Science Foundation 


    Share

Nikolas Smilovsky

Education: Ph.D. focus on Behavioral Geography and Environmental Perception (Grand Canyon University) M.S. in Geographic Information Systems (Arizona State University), B.A. in History (University of Florida) 

The following profile was compiled by Brendan Vander Weil (Texas State University) for the Encoding Geography initiative. To learn more, visit: https://www.ncrge.org/encoding-geography/


Please describe your job, employer, and the primary tasks you perform in your position.  

I work for a technology company that primarily produces integrated global navigation satellite system (GNSS) solutions for organizations around the world. Bad Elf, LLC is a leader in the global positioning market, being one of the first companies to productize GPS devices that plug into smart devices, a new type of technology referred to as the “bring your own device” market.  As the Director of Geospatial Solutions, I specifically work with customers that have field data collection needs. I help put together best practice training sessions and solutions for their organization based on specific needs. Working with various stakeholders, I ensure success whether that is profitability, time savings, or other more altruistic goals.  

What geographic knowledge, such as terminology and concepts, is important and useful to know in your line of work?  

Having a general understanding of geographic concepts is important, because all of my customers, clients, and partners are involved with something geospatial. It is also important to understand the technology associated with geography. For example, understanding geographic information systems (GIS), computer-aided drafting and design (CADD) software, light detection and ranging (LiDAR) hardware, or unmanned aerial vehicles (UAVs) aka drones have more applicability for Bad Elf. Additionally, understanding the science and math aka geodesy, underneath the geographic concept is paramount.  

What procedural geographic knowledge, such as spatial analysis using GIS or collecting spatial data, is important for you to know?  

Being able to leverage Bad Elf data collection devices to populate geodata repositories is what we do daily. One of my roles is to support customers that have goals of collecting high fidelity field data. This data is often used in analysis and or geographic inquiry. For example, I work with universities, government agencies, national laboratories, engineering firms, environmental consultants, land surveyors, biologists, planners, arborists, and architects who all do some type of procedural geographic tasks.   

Can you provide an example of a project where you apply geography and computer science to analyze and solve problems related to important issues? 

While I don’t often directly deal with solving important end-game issues, I do help the people that are breaking industry chains and are doing significant research/application. In a sense, I get to support the efforts intrinsically through my support. What is also extremely important to me, is that I get to help a wide plethora of people do better geography. Every day I get to help a different industry, organization, or even country tackle their specific geospatial conundrums.   

What types of geographic questions do you ask and think about in your work? 

I deal with every type of individual, organization, or entity that completes geospatial field data collection. The amount of technology and science that we work with and integrate is expansive. If you don’t have good geospatial data, you won’t complete good work. Thus, I ensure my customers can collect amazing, authoritative data so that they can perform their downstream tasks more efficiently and confidently. I may not get all the glory for completing these projects, but that is not important. What is important is being able to collect good data!  

What types of data did you acquire to support your work?  

Our GPS devices natively collect latitudinal, longitudinal, and elevational values, along with geodetic metadata associated with the acquisition of the spatial coordinates. Additionally, our devices are integrated into utility locators, which detect underground systems of infrastructure; laser rangefinders that help collect offset locations like tree heights; and most drones/LiDAR systems which collect remotely sense data like aerial imagery, point clouds, radiation, and non-visible light spectrums, and temperature.  

What types of knowledge and skills, both geographic and general, do you use to evaluate, process, and analyze the data you gather for your work? 

Mostly GIS software packages like Esri ArcGIS Pro or Q-GIS are used to evaluate the data procured by the Bad Elf devices. Additionally CAD programs like AutoCAD Civil 3D and BIM programs like Revit are used for modeling purposes. Additionally, we use computer programing languages like Python to manipulate the data.  

How do you communicate the results of your work? Do you have a recent product or publication to share with us as an example?  

We mostly make quantitative maps and spreadsheets showing our data and how they compare to other datasets. Our clients use hundreds of different methods and applications to complete this process. A perfect example of a customer using Bad Elf, Esri, Go Pro Cameras, tablets, and e-bikes to collect utility data is this case study from the town of Cave Creek, Ariz. 

How do you view your work in relation to civic engagement and issues that you care about?  

I engage daily with both the private and public sectors of our society so that they can better complete the tasks they set out to do. I eat, sleep, and dream geospatial. Every day that I get to engage in helping people do better spatial tasks is a great day.  

How does your career align with your values and aspirations in life now and back when you were a student?  

I feel very blessed because my employer and my values align extremely well. Aligning well with your organization is extremely important for your happiness and growth, but also for the organization to be successful. My father always said, “Nik you will eat a lot in your life, so enjoy your food. You will also sleep a lot, so enjoy your bed. Lastly you will work the most, so make sure you love your job!”  


This material is based upon work supported by the National Science Foundation under Grants No. 2031418, 2031407, and 2031380 (Collaborative Research: Encoding Geography – Scaling up an RPP to achieve inclusive geocomputational education). Any opinions, findings, and conclusions or recommendations expressed in this material are those of the author(s) and do not necessarily reflect the views of the National Science Foundation 


    Share

Locating Ourselves, and Our Purpose, in Time

Image of palm tree with background time lapse of starry night sky by Insung Yoon for Unsplash
Credit: Insung Yoon, Unsplash

As I wrap up my year serving as AAG president, I find myself experiencing a disorienting swirl of temporalities. First, there is the ever-present urgency of now, an endless eruption of new crises. I’m thinking, of course, of Robb Elementary School in Uvalde, Texas where nineteen children and two teachers were killed by an 18-year old armed with an assault rifle, just ten days after a self-described white supremacist, fascist believer in “replacement theory” murdered ten people in a grocery store in a predominantly Black neighborhood of Buffalo, New York. Even as geopolitical conflicts proliferate and climate change disasters accelerate, so too do mass shootings. The temporal gap between these horrific events has shrunk. Uvalde was the 27th school shooting, and the 213th mass shooting in the U.S. so far this year.   

Yet, having gone to college in the early 1990s, when a woman’s right to choose whether and when to have children was taken for granted as a Constitutionally guaranteed right, it’s hard not to simultaneously feel a sense of time moving backward. Many observers have noted that the leaked draft Supreme Court decision overturning Roe vs. Wade would “turn the clock back” by half a century. American historian Heather Cox Richardson has also compared it to the notorious 1857 Dred Scott decision, which took away what few rights Black Americans had. The ruling could presage further reversals of established rights — to contraception and same-sex marriage among others. And it will almost certainly lead to a substantial increase in pregnancy-related deaths, and reduced educational attainment and participation in the labor force by women. 

To take a rather different example, when I was in graduate school, there was a sense of great optimism about the increasing openness of China to international researchers, as well as growing academic cooperation and exchange. Today those doors have all but shut once again, and not just due to the pandemic. Since 2011, US law has prohibited NASA from funding any research involving coordination with any Chinese entity, and more recently, the US has restricted visas for Chinese students in high-tech fields. In the meantime, Chinese scholars face mounting barriers to participation in international academic conferences. Not a single scholar from the PRC is being allowed to participate at an upcoming international Tibetan studies conference in Europe this summer.   

All of this seems like a giant step in the wrong direction. At the very least, these events call the lie to any simple modernist notion of progress as a straight arrow of forward motion — of temporality as sequential coherence.  

* * * * *

I’ve described above a feeling of discordant temporalities. As geographers, though, we know that time is inseparable from space, and vice versa. As Doreen Massey famously argued, “the spatial is integral to the production of history, and thus to the possibility of politics, just as the temporal is to geography.” History is always spatial and as such does not literally repeat, stay still, or move backwards. Thinking in terms of space-time allows a conceptualization of openness and multiplicity, rather than the foreclosure of possibility.

Our current circumstances were not inevitable.   

More prosaically, many have already made the geographical observation that the US is exceptional among countries around the world in terms of per capita gun ownership (significantly more guns than people); in terms of the share of killings by guns; and in terms of its unique refusal to act. Other countries with cultures of gun ownership that have experienced mass shootings have tightened gun laws, leading mass shootings to become rare, and homicides and suicides to decrease. As many a comedian has quipped, if guns made us safer, the US would be the safest country in the world. If nothing else, geography’s commitment to an understanding of the globe could be more forcefully mobilized to counter the insularity of arguments that “there is no alternative” to senseless gun deaths in the US (or the insane proposition that the solution is to arm teachers — or to install mantraps in schools).  

Indeed, following the massacre at Marjory Stoneman Douglas High School in Parkland, Florida in 2018, then-AAG president Derek Alderman called for violence prevention and “non-killing geographies” to be the subject of a focused AAG initiative. While geographers have conducted extensive and excellent research on various forms of violence, the same cannot necessarily be said of organized advocacy to prevent violence, particularly by guns. That such advocacy is necessary despite the fact that a large majority of Americans already support universal background checks (81%), a ban on assault-weapons (63%), and a ban on high-capacity ammunition magazines (64%) is a product of the erosion of majority rule and arguably of democracy itself; this in turn is closely linked to the political geographic question of voting power and representation, particularly in the Senate.  

Can we do more, collectively and as geographers, to respond to threats to widely shared visions of a better socio-ecological future?

Can we agree that we want to work for a future with less violence and fewer dead schoolchildren, with racial justice rather than white supremacy, with a livable environment rather than cascading disasters, with respect for the full autonomous personhood of women, and with more, not less, cross-cultural, international cooperation and exchange?  

* * * * *

Returning more narrowly to the AAG and to academic geography, I’d like to briefly touch on a few other issues.  

First, it has been some time since Mona Domosh’s 2015 column on contingency in academic geography, yet precarity has clearly not disappeared. COVID-19 has only accelerated the restructuring of the academic labor market, further decreasing the ratio of tenure-track (TTT) to non-tenure track (NTT) faculty. In my own College, the explicit strategy for addressing the huge budgetary hole left by COVID-19 has been to incentivize TTT retirements and replace them with NTT positions. We all know that this works budgetarily because NTT faculty teach more and are paid less. Based on the living wage calculator developed by geographer Amy Glasmeier, starting salaries for full-time NTT faculty in my College do not constitute a living wage. And the situation is far worse in general for part-time adjuncts who are, around the country, hired semester to semester for a wage that is close to or perhaps even less than minimum wage if calculated on an hourly basis. Of course, the situation is different for “faculty of practice,” who have other careers and teach an occasional class out of personal interest. But for the vast majority, COVID-19 made an already terrible situation even worse  

At the same time, salaries of top university administrator salaries continue to soar. Whereas inflation-adjusted salaries of full professors mostly stayed flat or declined between 2009-2019, total compensation for presidents at public flagship universities increased by more than 50% over the same decade. The conversation thus needs to be not only about precarity, but also about inequality. Geographers have produced excellent scholarship about the corporatization and neoliberalization of the academy, including the way it produces gendered labor-led and care-led affective precarity. Moreover, the suggestions by both Mona Domosh and David Kaplan on how to create a more equitable academic culture are still relevant, and provide good suggestions for future AAG webinars for both contingent faculty themselves as well as department chairs and university administrators. Another step AAG could take is to collect data on contingent faculty specifically in Geography. Beyond training and information gathering, though, the evidence shows that collective bargaining is one of the few ways to make substantial progress; this too could be a topic of future AAG conversations.   

Second, in the upcoming year, AAG will be focusing on membership, both by improving benefits for existing members such as year-round webinars, and specifically trying to expand membership amongst physical geographers, geographers working outside of academia, and geographers teaching at community colleges. As community college faculty have pointed out, they have much to offer their peers at other institutions in terms of pedagogy. Furthermore, mutual cooperation with faculty at four-year institutions can only help increase the number of Geography majors, which itself is crucial to the future of the discipline.  

Third, I’d like to let you know that AAG is now an official sponsor of the Geography channel of the New Books Network, the largest book podcast in the world, with over 250,000 listeners per month. If you are interested in becoming a host, which entails interviewing other geographers about their work, please contact NBN directly. And if you’ve written a book, you can suggest it for a podcast interview here. This is a fantastic way of increasing the visibility of geographical scholarship.  

Finally, thinking ahead to next year’s annual meeting: there will be several different options for participation. First, you can attend in person, as before the pandemic, in Denver, Colorado. Second, you can participate online, taking part in virtual sessions as well as viewing in-person events. AAG has committed to streaming at least 50% of in-person events to virtual participants. As a remote participant your session may even be “beamed in” for viewing by those in Denver. Third, you might participate in a fully hybrid session, meaning one that has both in-person and remote participants interacting with each other. There will be capacity for 5-10% of sessions, particularly high-profile events and those selected by specialty groups, to be fully hybrid. Lastly, there will be a small number of pilot nodes — self-organized events consisting of group watching of selected streamed events, as well as optional local speakers or other activities. The goal of next year’s node experiments will be to scale up significantly for future conferences, starting in 2024.   

In closing, I want to thank you for the opportunity to serve the association this year. I have truly enjoyed meeting many of you at regional and other meetings, whether in person or online. I am very grateful to the many colleagues and friends who offered inspiration, information, and comments on newsletter columns. I have also been glad to hear from members who have taken the time to write to me about their concerns. Lastly, I want to recognize the entire AAG staff for the hard work they do behind the scenes to support geographers and geography.   

Thank you. 谢谢, ཐུགས་རྗེ་ཆེ་   

DOI: 10.14433/2017.0110


Please note: The ideas expressed in the AAG President’s column are not necessarily the views of the AAG as a whole. This column is traditionally a space in which the president may talk about their views or focus during their tenure as president of AAG, or spotlight their areas of professional work. Please feel free to email the president directly at emily [dot] yeh [at] colorado [dot] edu to enable a constructive discussion. 


    Share

Resources for Climate Action

Screenshot of statistics and impacts of drought in the U.S. as mapped in Esri ArcGIS Drought Aware map

This piece by Esri’s Global Education Manager Michael Gould is part of a series of sponsored articles from Esri.


Esri offers a huge collection of resources related to climate and sustainability topics. In 2022 we will publish a collection of learning/teaching resources to help non-climate-specialists at universities (primarily) to introduce climate action topics into their classroom or research activities, with a focus on solutions and opportunities to take action.

Resource Categories

The climate action resource collection is destined to find a home in Esri’s Climate Portal and be composed of packages many of which will include:

  • Datasets, covering physical and social phenomena
  • ArcGIS Learn lesson(s)
  • A StoryMap that sets the stage and provide context to each topic
  • In some cases, lightweb web applications to use when a full GIS implementation is not a requirement.

In order to maximize the general benefit of these resources we are working with collaborators from universities and partner organizations. Some collaborators provide use cases, others subject matter expertise, datasets, and/or frameworks that we can add value to via GIS workflows. One such framework is the collection of Climate Solutions from Project Drawdown. These include topics such as carpooling, bicycle infrastructure, and tree plantation. How can we use ArcGIS to make concrete and quantitative contributions towards those solutions?

Esri has a long track record working on environmental and climate related projects, and a few years back we started hosting a huge collection –hundreds of themes or layers– of curated geographic information: the ArcGIS Living Atlas of the World. Many other Esri resources now draw on that rich data source, and we anticipate that your workflows, classroom exercises, and research projects will do likewise. Not only do you have access to Esri-created data but also to data contributed by collaborators around the world: agencies such as NASA, NOAA, Census, cities and local governments, and commercial partners. You can nominate your own datasets –research results for example– for inclusion in the Living Atlas and the content will be automatically checked for metadata completeness and other measures, and then be human-checked and curated by Esri’s subject matter experts. Once included the dataset is hosted by Esri and made available to GIS users around the world.

In this post, I’ll walk through two scenarios for using these resources to investigate climate issues and developing action plans.

Extreme Drought

When we search the Atlas on the keyword “climate” and filter on data only from the past year, we find 391 (at the time of this writing) related resources. Try for yourself and experience the diversity of topics, geographical extents, and data contributors.

Try other related keywords too, for example environment or drought. The latter points us to NOAA-provided data feeds for the USA, for example US Drought Intensity—Current Conditions which is “live” data updated weekly.

A screenshot of the ArcGIS Living Atlas of the World website
Figure 1. ArcGIS Living Atlas of the World.


A screenshot of a map of drought intensity in the United States
Figure 2. A map of drought intensity in the United States.


This is just one of many examples of up-to-date, climate-oriented data that have been symbolized, pop-ups configured, and made available for your classroom or research projects to be combined with socioeconomic data sources in order to determine who is affected, for example.

This live-feed feature layer could be used in ArcGIS Pro or the ArcGIS Online Map Viewer, but in this case, it is the basis of the Drought Aware web application that is also hosted on the Living Atlas. In addition to drought data, this app includes layers from the US Census American Community Survey and from the US Department of Agriculture. In the image below, we selected a county in the Oklahoma panhandle and the application queried the drought and underlying census and agricultural data layers to show several indicators below in dashboard style. Texas County, Oklahoma is in a period of extreme drought. While the population is modest (20,000 inhabitants), over $1 Billion of agricultural sales are affected, mostly livestock. Also at the bottom is a time series for that selected county, and we can click on the graph to see drought conditions at any period going back to 2000 (April 2018 selected in this image).

Screenshot of the Drought Aware web app
Figure 3. The Drought Aware app showing historic trends, current conditions, and impacts of drought in the United States.


For more information about the contents and use of the Drought Aware application, one of several thematic “Aware” apps, see creator Dan Pisut’s blog post.

Sea Level Rise

Another climate related issue that can be investigated with GIS is sea level rise, starting with a High Tide Flooding Scenarios dataset also from NOAA. Again that data layer could be used alone, but is included in a web app that compares several flooding scenario predictions through the year 2100. We selected Oregon Inlet, North Carolina, and from the Intermediate flooding model (assuming 1 meter sea level rise) it shows that “sunny day” flooding events would go from 13 (2022) to 34 (2032) days per year. And that’s just in the coming decade and for the fairly conservative Intermediate model: it could be much worse. Try the app for yourself: have a look at the Gulf of Mexico near New Orleans or Houston for example.

Screenshot of maps showing flooding probability
Figure 4. High Tide Flooding Probability Scenarios.


Now, just as with the drought dataset, we can repeat the process known as geo-enrichment to add sociodemographic layers and then drill into specific flooding areas to ask who is or would be affected. We could open the flooding scenarios layer in ArcGIS Pro, select Intermediate, experiment with the time slider, manipulate symbology, and then we can join the CDC Social Vulnerability Index (SVI) 2018 data. SVI data are composed of 15 social factors in 4 themes: Socioeconomic, Housing composition and disability, Minority status and language, and Housing and transportation.

The spatial join used the nearest feature and a 1 Km radius, to create a bivariate map showing percent change in flooding risk and SVI score (see the cube with cyan and magenta symbology) of each location. Colors tending toward purple in the cube indicate high vulnerability.

Screenshot of map showing potential impact of flooding on vulnerable populations
Figure 5. Potential impact of coastal flooding on vulnerable populations.


For more information on this flooding scenario, see this blog post by Keith VanGraafeiland. The javascript code for the High Tide app is available on github.

Create your Own

These are just two examples of climate action workflows that help to help bring home the message of dangerous climate-related phenomena that affect certain populations in certain locations, now and in the future. We encourage you to join us in creating new exercises as part of the Climate Action resource collection, so that other instructors, learners, and researchers can analyze geographic data from their desktop GIS, Map Viewer, or web application. Let’s show the world how GIS can make concrete contributions to climate resilience.

    Share

Brent Sams

Education: Ph.D. in Horticulture (University of Adelaide), Master of Geography (Virginia Tech), B.S. in Geography (University of North Alabama)  

The following profile was compiled by Brendan Vander Weil (Texas State University) for the Encoding Geography initiative. To learn more, visit: https://www.ncrge.org/encoding-geography/ 


Describe your job, employer, and the primary tasks you perform in your position.  

My current role as a Viticulture Research Scientist at E&J Gallo Winery is to design and execute research projects focused on understanding how fruit chemistry/quality change over time and space. I am interested in these changes from the within-vineyard scale to the regional scale. To accomplish this, I (with a lot of help from others) use a wide variety of field measurements (fruit zone light exposure, vine canopy temperature, soil cores, and many others), proximal sensing (electric conductivity, elevation mapping), and remote sensing (satellite, UAV, commercial aircraft). I spend a good deal of time analyzing how these measurements are connected.  

How has your education/background in geography prepared you for this position? 

The interaction of geography and computer science is essential for my role, along with many others in my department. At the project level, I work with different types of datasets that must be organized so that they can be analyzed and interpreted together. I rarely start any of this in GIS, but in a statistics package/program. I don’t have a background in computer science or coding/programming, but these have been very useful skills to develop. Once I have a product/model/application, it needs to be available for use by our stakeholders. This can be a dashboard, a database, or other digestible format which usually implies additional knowledge of other programs or applications. Probably the most specific use of geo-computation in my role is in the geostatistical analyses of grape samples collected from different densities and locations.  

What is an example of applying geography concepts and skills in order to analyze and solve problems in your work? 

Recently, we’ve been working on a project to combine data from multiple vineyards to add statistical robustness to the spatial analysis of low-density grape samples. To validate the method, we divided up the vineyards into fishnet grids to create a Monte Carlo simulation that would iterate through many different combinations of field samples based on their locations.  

What types of geographic questions did you ask and think about in your project? 

We were interested in how wine grape chemistry changed over time and space, and at specific locations from the within-vineyard scale to the regional or statewide scale; how farm management and the environment are connected; and how we could use all of these variables to make predictions about where to find the best fruit. All this information needed to be synthesized and made into something that could be analyzed by a computer. Sometimes in the quantitative analysis world we are faced with qualitative variables and how to incorporate things like, “How does this vineyard manager decide when and how much water to irrigate?.” These then need to be summarized into something we can include in a mathematical model.   

What types of data did you acquire to support your project?  

For this project, we were mostly interested in the chemistry of grapes processed in a lab after the sample location was tagged with a GPS unit. In a related project and at the same locations, we measured soil texture, the fraction of useful light into the fruit zone of the canopy, and yield.  

What types of content knowledge and skills (both geographic and more general) did you use to evaluate, process, and analyze the data you gathered for your project? 

Everything starts with the synthesis of what’s been done, where, and how. Experimental design and sampling strategies are also necessary. There are a lot of measurements specific to grapevines that we used, but general statistical knowledge was also necessary for writing reports, publications, etc. I use R and R Studio quite a bit, as well as several GIS applications with a bunch of different spatial analyses. One specific example is the use of k-means classification with raster datasets to assess patterns that exist between different layers such as interpolated chemistry maps with soil maps or imagery.   

How did you communicate the results of your project (e.g., writing technical reports, making maps and geo-visualizations, creating graphics, data tables, etc.)? Do you have a recent product or publication to share with us as an example?  

There will be a few publications from this data set, as well as reports to internal stakeholders. You can find those publications below:   

  • Sams, B., Bramley, R.G.V., Sanchez, L., Dokoozlian, N.K., Ford, C.M., and Pagay, V. (2022) Remote sensing, yield, physical characteristics, and fruit composition variability in Cabernet Sauvignon vineyards. American Journal of Enology and Viticulture 73, 93-105. 
  • Sams, B., Bramley, R., Sanchez, L., Dokoozlian, N., Ford, C. and Pagay, V. (2022) Characterising spatio-temporal variation in fruit composition for improved winegrowing management in California Cabernet Sauvignon. Australian Journal of Grape and Wine Research. https://doi.org/10.1111/ajgw.12542 
  • Sams, B., Bramley, R., Aboutalebi, M., Sanchez, L., Dokoozlian, N.K., Ford, C.M. and Pagay, V. (2022) Facilitating mapping and understanding of within-vineyard variation in fruit composition using data pooled from multiple vineyards. Australian Journal of Grape and Wine Research. https://doi.org/10.1111/ajgw.12556 

What are the criteria that you use to assess the quality of your results?  

I’m an applied researcher in the private sector, so while the publications are nice, I really want to know if something works. Does it help us do something, save us money, or even make us more money?


This material is based upon work supported by the National Science Foundation under Grants No. 2031418, 2031407, and 2031380 (Collaborative Research: Encoding Geography – Scaling up an RPP to achieve inclusive geocomputational education). Any opinions, findings, and conclusions or recommendations expressed in this material are those of the author(s) and do not necessarily reflect the views of the National Science Foundation 


    Share

Suparna Das

Education: Ph.D. in Geography (University of Utah), M.A. in Regional Planning and Development (Jawaharlal Nehru University), B.S. in Geography (University of Calcutta) 

The following profile was compiled by Brendan Vander Weil (Texas State University) for the Encoding Geography initiative. To learn more, visit: https://www.ncrge.org/encoding-geography/


Please describe your job, employer, and the primary tasks you perform in your position.  

I’m currently responsible for supervising an expanding group of talented statisticians, behavioral health scientists, data analysts and epidemiologists. Together we manage data collection efforts, disseminate various products (reports, publications, briefings, policy documents) and advise behavioral health policies for the administration. The Treatment Services Branch (TSB) is responsible for three major behavioral health data collection and surveillance systems: Drug Abuse Warning Network (DAWN) and Behavioral Health Information Surveillance Systems (BHSIS) and provide all statistical support for Buprenorphine Waiver Notification Systems (BWNS).  

Before joining SAMHSA in March 2021, for close to seven years I was working as the statistician and viral hepatitis epidemiologist for DC Department of Health (DOH). I was also part of the COVID-19 Task force for DC from 2020–2021. 

How has your education/background in geography prepared you for this position? 

Geo-computation, from my understanding, is the “art and science of solving complex geographical (spatial) problems through computation” (Source unknown). I want to take this opportunity to iterate that Geographical Information Systems (GIS) and Geographical Information Sciences (GISc) are NOT interchangeable. I strongly believe that we as geographers can do a lot more than make maps. This belief has been the central tenet of my career in public service. We can assist decision-making in the most scientific method with our understanding of space and spatial changes over time.   

As a graduate student in India (Jawaharlal Nehru University (JNU)) and the U.S. (University of Utah), I was lucky to have received extensive training as a spatial scientist and demographer. This expanded my understanding of population sciences and geo-computation, which I apply every day in my position to improve health outcomes for people. 

What is an example of applying geography concepts and skills in order to analyze and solve problems in your work? 

I have several projects that are currently being implemented where I am using geo-computational methodologies, but we will have to wait for them to be released through SAMHSA. For me, it is impossible to resolve mental health and substance abuse disparities and encourage health equity without spatial thinking and geo-computation. SAMHSA (specially CBHSQ) understands that and encourages discussion on applying geo-computation while also supporting and encouraging researchers to use https://findtreatment.samhsa.gov/ for analytical and geo-computational purposes, among many other projects.  

From my previous position at DC DOH, where I spent close to seven years, I was able to implement several geo-computational projects. I published as much as I could to make sure people knew about administrative data collection and the impact of geo-computation in policy. One project example is DC’s effort to End the HIV Epidemic (EHE).  

I was proud to have been an integral part of the EHE implementation with the DC DOH, which has achieved the first of its 90/90/90 goals (https://www.dcendshiv.org/) of 90% of people living with HIV being aware of their HIV status (and now aiming for 95%). We were committed to implementing evidence-based policies to improve care for people living with HIV and create access to prevention and tools to stop new infections.   

I used spatial analysis to find high-risk areas that needed immediate attention, resource re-allocation, and Pre-Exposure Prophylaxis (PrEP) to reach the EHE goals. I was responsible for monitoring and evaluation (M&E) of Centers for Disease Control and Prevention’s Social Network Strategy (SNS) to identify new HIV diagnoses for DC.  

For M&E, I was responsible for programmatic data collection, program monitoring, evaluating the programs and the outcomes, providing technical support and assisting in resource allocation. I then mapped the outcomes for the community-based organizations (CBOs) for improvements. The project was instrumental to a separate proposal for using geolocation-based applications to identify new HIV diagnoses for states to implement.  

What types of geographic questions did you ask and think about in your project? 

My questions as a public servant always have a two-tier approach:  

In the first tier: What is the impact of my project on the lives of people and what outcome do I want to answer through this project. I restrict my projects to non-exploratory but policy-oriented questions.  

In the second tier: My projects span demography, GISc and spatial epidemiology or health geography. I do not have any projects or have been part of any project that does/did not entail extensive statistical/data management-based coding.  

What types of data did you acquire to support your project?  

I always use administrative data collection for my projects within my role as a public servant. These data collection tools inform policies within the administration. I encourage researchers in academic settings to use them as well. There are several administrative data sets available which can be instrumental in framing accurate questions. I also encourage researchers to read annual reports to understand their needs. SAMHSA has several such data collection efforts which are publicly available through public use files https://www.samhsa.gov/data/ 

What types of content knowledge and skills (both geographic and more general) did you use to evaluate, process, and analyze the data you gathered for your project? 

A large part of my job is to make sure that administrative data is collected without any glitches and plan how to enhance data collection so that it will assist health related policies in the United States. The scope of each ongoing project is different, thus, as a supervisor, my job is to assign it to the appropriate subject matter expert (SME) who would be responsible to evaluate, process and analyze the data.  

As for projects that I take interest in, they are ones that have a large spatio-temporal aspect to it or have predictive capacity.  

How did you communicate the results of your project (e.g., writing technical reports, making maps and geo-visualizations, creating graphics, data tables, etc.)? Do you have a recent product or publication to share with us as an example?  

I have communicated my results to multiple stakeholders, ranging from scientific audiences, panels, political stakeholders, community-based organizations, legal groups, media (including interviews), administrative leaderships, and the public. The communication strategies I use differ based on the audience. I have generated reports, technical documentation, maps for program evaluation for resource allocation, publications, and conference proceedings.  

What are the criteria that you use to assess the quality of your results 

I look at the impact of my project on improving health outcomes for people and its scientific validity – in other words, I’m looking at the impact of my results on implementing evidence-based policy. 


This material is based upon work supported by the National Science Foundation under Grants No. 2031418, 2031407, and 2031380 (Collaborative Research: Encoding Geography – Scaling up an RPP to achieve inclusive geocomputational education). Any opinions, findings, and conclusions or recommendations expressed in this material are those of the author(s) and do not necessarily reflect the views of the National Science Foundation 


    Share
    Share

Do Look Up

Image of palm tree with background time lapse of starry night sky by Insung Yoon for Unsplash
Credit: Insung Yoon, Unsplash

As I wrap up my year serving as AAG president, I find myself experiencing a disorienting swirl of temporalities. First, there is the ever-present urgency of now, an endless eruption of new crises. I’m thinking, of course, of Robb Elementary School in Uvalde, Texas where nineteen children and two teachers were killed by an 18-year old armed with an assault rifle, just ten days after a self-described white supremacist, fascist believer in “replacement theory” murdered ten people in a grocery store in a predominantly Black neighborhood of Buffalo, New York. Even as geopolitical conflicts proliferate and climate change disasters accelerate, so too do mass shootings. The temporal gap between these horrific events has shrunk. Uvalde was the 27th school shooting, and the 213th mass shooting in the U.S. so far this year.   

Yet, having gone to college in the early 1990s, when a woman’s right to choose whether and when to have children was taken for granted as a Constitutionally guaranteed right, it’s hard not to simultaneously feel a sense of time moving backward. Many observers have noted that the leaked draft Supreme Court decision overturning Roe vs. Wade would “turn the clock back” by half a century. American historian Heather Cox Richardson has also compared it to the notorious 1857 Dred Scott decision, which took away what few rights Black Americans had. The ruling could presage further reversals of established rights — to contraception and same-sex marriage among others. And it will almost certainly lead to a substantial increase in pregnancy-related deaths, and reduced educational attainment and participation in the labor force by women. 

To take a rather different example, when I was in graduate school, there was a sense of great optimism about the increasing openness of China to international researchers, as well as growing academic cooperation and exchange. Today those doors have all but shut once again, and not just due to the pandemic. Since 2011, US law has prohibited NASA from funding any research involving coordination with any Chinese entity, and more recently, the US has restricted visas for Chinese students in high-tech fields. In the meantime, Chinese scholars face mounting barriers to participation in international academic conferences. Not a single scholar from the PRC is being allowed to participate at an upcoming international Tibetan studies conference in Europe this summer.   

All of this seems like a giant step in the wrong direction. At the very least, these events call the lie to any simple modernist notion of progress as a straight arrow of forward motion — of temporality as sequential coherence.  

* * * * *

I’ve described above a feeling of discordant temporalities. As geographers, though, we know that time is inseparable from space, and vice versa. As Doreen Massey famously argued, “the spatial is integral to the production of history, and thus to the possibility of politics, just as the temporal is to geography.” History is always spatial and as such does not literally repeat, stay still, or move backwards. Thinking in terms of space-time allows a conceptualization of openness and multiplicity, rather than the foreclosure of possibility.

Our current circumstances were not inevitable.   

More prosaically, many have already made the geographical observation that the US is exceptional among countries around the world in terms of per capita gun ownership (significantly more guns than people); in terms of the share of killings by guns; and in terms of its unique refusal to act. Other countries with cultures of gun ownership that have experienced mass shootings have tightened gun laws, leading mass shootings to become rare, and homicides and suicides to decrease. As many a comedian has quipped, if guns made us safer, the US would be the safest country in the world. If nothing else, geography’s commitment to an understanding of the globe could be more forcefully mobilized to counter the insularity of arguments that “there is no alternative” to senseless gun deaths in the US (or the insane proposition that the solution is to arm teachers — or to install mantraps in schools).  

Indeed, following the massacre at Marjory Stoneman Douglas High School in Parkland, Florida in 2018, then-AAG president Derek Alderman called for violence prevention and “non-killing geographies” to be the subject of a focused AAG initiative. While geographers have conducted extensive and excellent research on various forms of violence, the same cannot necessarily be said of organized advocacy to prevent violence, particularly by guns. That such advocacy is necessary despite the fact that a large majority of Americans already support universal background checks (81%), a ban on assault-weapons (63%), and a ban on high-capacity ammunition magazines (64%) is a product of the erosion of majority rule and arguably of democracy itself; this in turn is closely linked to the political geographic question of voting power and representation, particularly in the Senate.  

Can we do more, collectively and as geographers, to respond to threats to widely shared visions of a better socio-ecological future?

Can we agree that we want to work for a future with less violence and fewer dead schoolchildren, with racial justice rather than white supremacy, with a livable environment rather than cascading disasters, with respect for the full autonomous personhood of women, and with more, not less, cross-cultural, international cooperation and exchange?  

* * * * *

Returning more narrowly to the AAG and to academic geography, I’d like to briefly touch on a few other issues.  

First, it has been some time since Mona Domosh’s 2015 column on contingency in academic geography, yet precarity has clearly not disappeared. COVID-19 has only accelerated the restructuring of the academic labor market, further decreasing the ratio of tenure-track (TTT) to non-tenure track (NTT) faculty. In my own College, the explicit strategy for addressing the huge budgetary hole left by COVID-19 has been to incentivize TTT retirements and replace them with NTT positions. We all know that this works budgetarily because NTT faculty teach more and are paid less. Based on the living wage calculator developed by geographer Amy Glasmeier, starting salaries for full-time NTT faculty in my College do not constitute a living wage. And the situation is far worse in general for part-time adjuncts who are, around the country, hired semester to semester for a wage that is close to or perhaps even less than minimum wage if calculated on an hourly basis. Of course, the situation is different for “faculty of practice,” who have other careers and teach an occasional class out of personal interest. But for the vast majority, COVID-19 made an already terrible situation even worse  

At the same time, salaries of top university administrator salaries continue to soar. Whereas inflation-adjusted salaries of full professors mostly stayed flat or declined between 2009-2019, total compensation for presidents at public flagship universities increased by more than 50% over the same decade. The conversation thus needs to be not only about precarity, but also about inequality. Geographers have produced excellent scholarship about the corporatization and neoliberalization of the academy, including the way it produces gendered labor-led and care-led affective precarity. Moreover, the suggestions by both Mona Domosh and David Kaplan on how to create a more equitable academic culture are still relevant, and provide good suggestions for future AAG webinars for both contingent faculty themselves as well as department chairs and university administrators. Another step AAG could take is to collect data on contingent faculty specifically in Geography. Beyond training and information gathering, though, the evidence shows that collective bargaining is one of the few ways to make substantial progress; this too could be a topic of future AAG conversations.   

Second, in the upcoming year, AAG will be focusing on membership, both by improving benefits for existing members such as year-round webinars, and specifically trying to expand membership amongst physical geographers, geographers working outside of academia, and geographers teaching at community colleges. As community college faculty have pointed out, they have much to offer their peers at other institutions in terms of pedagogy. Furthermore, mutual cooperation with faculty at four-year institutions can only help increase the number of Geography majors, which itself is crucial to the future of the discipline.  

Third, I’d like to let you know that AAG is now an official sponsor of the Geography channel of the New Books Network, the largest book podcast in the world, with over 250,000 listeners per month. If you are interested in becoming a host, which entails interviewing other geographers about their work, please contact NBN directly. And if you’ve written a book, you can suggest it for a podcast interview here. This is a fantastic way of increasing the visibility of geographical scholarship.  

Finally, thinking ahead to next year’s annual meeting: there will be several different options for participation. First, you can attend in person, as before the pandemic, in Denver, Colorado. Second, you can participate online, taking part in virtual sessions as well as viewing in-person events. AAG has committed to streaming at least 50% of in-person events to virtual participants. As a remote participant your session may even be “beamed in” for viewing by those in Denver. Third, you might participate in a fully hybrid session, meaning one that has both in-person and remote participants interacting with each other. There will be capacity for 5-10% of sessions, particularly high-profile events and those selected by specialty groups, to be fully hybrid. Lastly, there will be a small number of pilot nodes — self-organized events consisting of group watching of selected streamed events, as well as optional local speakers or other activities. The goal of next year’s node experiments will be to scale up significantly for future conferences, starting in 2024.   

In closing, I want to thank you for the opportunity to serve the association this year. I have truly enjoyed meeting many of you at regional and other meetings, whether in person or online. I am very grateful to the many colleagues and friends who offered inspiration, information, and comments on newsletter columns. I have also been glad to hear from members who have taken the time to write to me about their concerns. Lastly, I want to recognize the entire AAG staff for the hard work they do behind the scenes to support geographers and geography.   

Thank you. 谢谢, ཐུགས་རྗེ་ཆེ་   

DOI: 10.14433/2017.0110


Please note: The ideas expressed in the AAG President’s column are not necessarily the views of the AAG as a whole. This column is traditionally a space in which the president may talk about their views or focus during their tenure as president of AAG, or spotlight their areas of professional work. Please feel free to email the president directly at emily [dot] yeh [at] colorado [dot] edu to enable a constructive discussion. 


    Share

Developing Crip Care Networks for (Pandemic) Survival