Jennifer Whytlaw Joins GISCI Board as AAG Representative
The GIS Certification Institute (GISCI) Board of Directors has welcomed Jennifer L. Whytlaw, Ph.D., GISP, associate professor of Applied GIS at Old Dominion University, as the newest representative of the American Association of Geographers (AAG). She joins Darcy Boellstorff, who recently renewed her term as AAG’s second representative on the board.
Founded in 2002 by member organizations including AAG, GITA, NSGIC, UCGIS, and the Geospatial Professional Network (GPN, formerly URISA), GISCI is a nonprofit organization that administers the internationally recognized GISP® (Certified GIS Professional) credential. The GISCI Board meets monthly to guide certification policies, strategic priorities, and initiatives that support excellence and professionalism across the geospatial community.
As a GISP since 2012, Whytlaw brings both professional expertise and a strong commitment to advancing the GIS profession. Throughout her career, she has promoted ethical and professional standards in GIS while inspiring the next generation of geospatial professionals through teaching, mentoring, research, and outreach.
At Old Dominion University, Whytlaw teaches undergraduate and graduate students, advises student research, and mentors emerging professionals as they pursue careers and advanced degrees. Her commitment to workforce development extends beyond higher education. She has been an active advocate for introducing GIS in K-12 classrooms, applying for educational grants, supporting GIS-integrated science curricula, and participating in STEM outreach programs that expose younger students to career opportunities in geospatial technology.
Looking ahead, Whytlaw is enthusiastic about helping GISCI strengthen its engagement with students and early-career professionals. Reflecting on her goals as a board member, she noted: “I would like to enhance GISCI’s outreach and engagement with student-focused programs such as mentorship programs and online resources targeted toward all types of colleges and universities, ensuring the future sustainability of the GIS profession.”
She also sees an opportunity for GISCI to continue evolving alongside rapidly advancing technologies: “A second focus area would be continuing the integration of new and emerging geospatial technologies, such as Artificial Intelligence, Machine Learning, and XR [extended reality] technologies, into the GISCI’s certification process to ensure relevance and preparedness for the future of GIS.”
As a founding GISCI member organization, AAG plays an important role in helping ensure that GIS certification reflects the needs and perspectives of the geography and GIScience communities. Whytlaw’s experience in education, outreach, and emerging technologies will provide valuable insight as GISCI continues to advance the GISP credential and support the future of the profession.
AAG Journal Articles on Queer and Trans Geographies
In celebration of Pride 2026, AAG is offering free access to these articles on queer and trans geographies from June 1 until July 15, 2026. These articles are available for download at the links listed below.
Building Healthier Cities: A Call for Geographers and Building Professionals to Collaborate through Geospatial Data
By Oluwaseun Ipede
As our cities grow more complex and environmental crises mount, urban sustainability is no longer a theoretical discussion; it’s an existential necessity. Among the greatest challenges facing 21st-century cities is balancing rapid urbanization with public health and environmental sustainability. At the heart of this challenge lies an indispensable asset: Geospatial data.
Geospatial data is the connective tissue that binds physical infrastructure, human behavior, and environmental systems. But data alone is not enough. Its responsible use requires geographers, academic and professional, human and physical, cartographic and computational, to engage collaboratively with built environment professionals such as architects, engineers, and construction (AEC) specialists. In doing so, we can transform urban spaces into sustainable, healthy cities that serve both people and the planet.
This perspective calls for a more intentional convergence between academic geography and the built environment professions. We must create stronger alliances between geographers and AEC practitioners to unlock the full potential of geospatial technologies, not only for smarter infrastructure but for a higher Public Health Index (PHI), a metric that integrates the determinants of health within the spatial context of urban development.
Why Geospatial Thinking Matters in the AEC World
The AEC sector is in the midst of a digital revolution driven by tools such as Building Information Modeling (BIM), GIS, IoT, and AI. Yet, what’s often missing from this techno-centric evolution is geographical thinking, the ability to analyze the spatial dimensions of urban life, social equity, and environmental justice.
AEC professionals typically design and construct the built environment based on functional needs, client specifications, and engineering requirements. But without geographers’ input, they may overlook socio-spatial disparities, ecological sensitivity, or historical injustices embedded in urban landscapes.
By leveraging geospatial data, geographers can help architects and engineers ask better questions:
Are green spaces equitably distributed?
What neighborhoods face the highest air pollution burden?
Where are vulnerabilities to urban heat islands concentrated?
How does access to healthcare, clean water, and public transport vary across districts?
These are not only public health questions, but also inherently geographic questions. The answers lie in maps, models, and location-based data.
Public Health and Urban Sustainability: A Spatial Convergence
There is growing recognition that the health of urban populations is shaped more by where people live than by individual behavior. The WHO’s urban health framework emphasizes that air quality, noise pollution, walkability, access to nature, and housing conditions are all place-based determinants of health.
In a 2021 article in Nature Sustainability, Nieuwenhuijsen et al. demonstrated how integrated urban and transport planning using spatial models could significantly reduce premature deaths in cities by designing healthier environments. Similarly, the Lancet Global Health commission on urban design highlighted the health dividends of data-informed land use, mobility, and environmental planning (Giles-Corti et al., 2016).
The missing piece? Systematic and sustained collaboration between academic geographers and built environment professionals, rooted in shared access to data and mutually informed practices.
Junnar, Maharashti, India. Building and planning professionals should work more closely with geographers to capture the full range of geoinformation about places, such as the distribution of green space, health outcomes for residents, history and context, and more. Credit: Zoshua Colah, Unsplash
Bridging Academic Research and Real-World Impact
Academic geography often generates invaluable insights into urban systems, population health, environmental exposure, and spatial justice. Yet, these insights are frequently siloed, buried in journals, datasets, or local case studies without pipelines into professional practice.
By contrast, AEC professionals often possess the authority and tools to shape real environments but may lack the time or training to engage with cutting-edge geographic research. The result is a fragmentation that wastes both insight and opportunity.
A more effective model would:
Create applied research partnerships where academic institutions support municipal projects with geospatial modeling, health risk mapping, or sustainability planning.
Co-develop open data platforms that bring together public health data, environmental monitoring, land use, and infrastructure systems.
Embed geographers in interdisciplinary planning teams within urban design firms, public agencies, and NGOs.
Incentivize knowledge translation, encouraging academics to publish not only in peer-reviewed outlets but also in formats digestible by policymakers, planners, and engineers.
Through these approaches, we transform geographic knowledge into actionable intelligence for healthier cities.
The Role of Data Collaboration: Optimism over Obstacles
It’s true that data limitations exist, especially in the Global South, where political sensitivities or institutional gaps can impede access. But rather than accepting these barriers, we should see them as challenges to overcome through professional solidarity and innovative collaboration. Emerging models such as data cooperatives, public-private academic partnerships, and community mapping projects (e.g., Humanitarian OpenStreetMap) demonstrate how diverse stakeholders can pool geospatial data to fill critical gaps.
Data availability and collaboration challenges are not exclusive to the Global South, they also exist in the Global North, though in different forms. In wealthier contexts, issues often revolve around data fragmentation, siloed institutional access, and proprietary restrictions by private firms. Despite robust infrastructure, academic research, and AEC professionals in the Global North still face hurdles in sharing and integrating geospatial data for public benefit. Collaborative initiatives, but the need for stronger academic-practitioner synergy remains. The opportunity to blend research with practice to improve public health through spatial insights is global. AEC professionals can enhance this effort by sharing non-sensitive spatial data collected during design or construction phases, site assessments, building footprints, and environmental impact data back into public or academic domains. Meanwhile, universities and research institutes can act as neutral custodians of data, improving transparency and trust.
Everyone Has a Geographic Role
No matter their specialization–transport geographers, medical geographers, climate modelers, or remote sensing analysts–every geographer works with “place” as a foundational concept. And every AEC professional works in a place, whether designing a water pipeline, planning a hospital, or modeling a transportation network.
This shared concern with space and place is the starting point for collaboration.
We must redefine geography not only as a field of academic inquiry but as an action-oriented discipline embedded in urban development processes. Geography, through its emphasis on scale, systems, and connections, offers a language to unify the fragmented efforts of planners, builders, public health experts, and citizens.
By foregrounding geospatial data and geographical expertise, we can help cities evolve not just in form, but in function, as ecosystems of wellbeing.
Conclusion: Toward a Healthy Urban Future
As a multidisciplinary expert, I stand at the intersection where physical space meets digital insight. I’ve witnessed firsthand how each role contributes a vital piece to the urban puzzle, from capturing accurate terrain models with GPS/drones to analyzing social disparities with spatial data. What’s clear is that no single discipline holds the key to building sustainable, healthy cities. It is only through intentional collaboration between academic researchers and built environment professionals that we can truly unlock the power of location-based data.
Geospatial data is not just about maps, it’s about meaning. When survey data informs urban models, when drone imagery validates land cover changes, and when GIS connects these insights to public health indicators, we move beyond design toward decision-making for human well-being. Geography isn’t just a field; it’s a framework. It equips us to see connections, understand patterns, and act across scales.
The future of our cities depends on breaking down silos, sharing data openly, and applying geographic thinking across professions. It’s time we all, academics and practitioners alike, step up as co-creators of healthier, more equitable urban spaces. After all, everything happens somewhere. And where it happens matters. “Everything is related to everything else, but near things are more related than distant things.”
This article is based on the author’s presentation on urban oases during AAG 2025 in Detroit.
Perspectives is a column intended to give AAG members an opportunity to share ideas relevant to the practice of geography. If you have an idea for a Perspective, see our guidelines for more information.
This is the last message by outgoing 2024-2026 Council Treasurer Antoinette WinklerPrins. In her earlier series, she helped illuminate several financial dimensions of a professional organization such as the AAG. In this column, she shares a visualization of the income and expenses flow of the AAG’s Annual Meeting. Read previous columns.
We recently gathered for our annual meeting in San Francisco—a celebration of the broad and diverse community that geographers are. The annual meeting is a key activity for the organization and its members. We had over 5,000 registrants and 1,200 sessions, with the majority being held in person, with a hybrid option for session organizers who opted in. Running a meeting is an expensive affair, and arrangements are usually made many years ahead of time, with some costs locked in while others are set at the time of the meeting. This means that there can be inflationary pressures on costs, as there was this year.
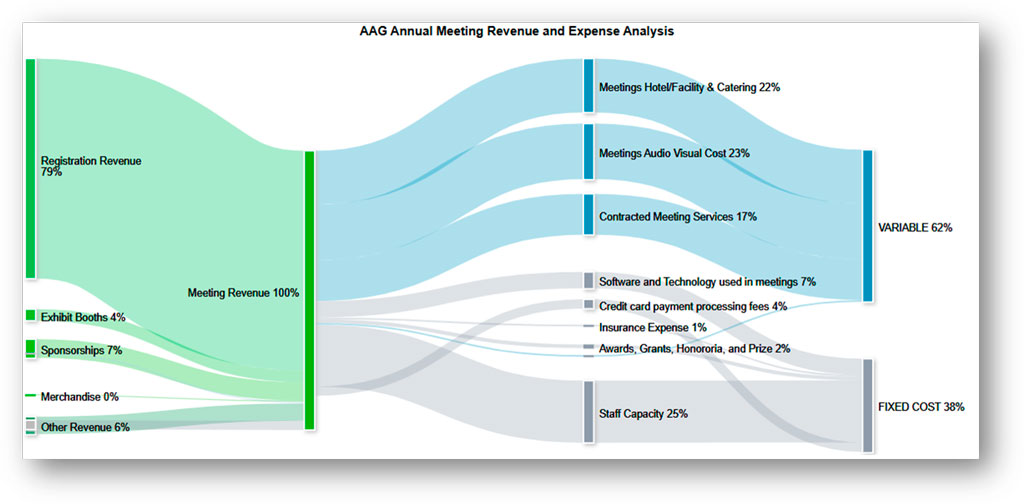
The figure below illustrates the flow of the 2026 AAG Annual Meeting Revenue and Expenses—demonstrating the fixed and variable costs that must be accounted for.
Credit: Betsy Orgodol
The AAG operates on a break-even model for its annual meeting and sets its registration fee accordingly, but has to do so ahead of time without knowing precisely how many people will register, nor how some costs will change.
Annual Meeting variable expenses consist primarily of usage-based costs such as catering, certain hotel and facility fees, and audiovisual services—these are not fixed when the contract is signed, and depend on factors such as the number of registrants and number of sessions. The AAG contracts several meeting services, such as meeting and exhibit managers, decorators, childcare services, conference assistants, security, and service providers for conference participants who need accommodation. Staff capacity, insurance, and software technology fees are largely fixed costs that do not change based on the size of the meeting or the number of attendees.
The cost structure the AAG uses provides more flexibility and scalability—when attendance is strong, total expenses rise proportionally but are matched by increased registration and sponsorship revenue, enabling the organization to serve more participants without compromising the quality of the meeting experience. When attendance is smaller, costs decrease in areas like catering and certain service charges, though only to a limited extent since some baseline expenses remain fixed; even so, the meeting can be delivered efficiently while maintaining a consistent standard of value for attendees.
The AAG consistently works to control more costs to ensure that resources are used efficiently and that the meeting remains both financially sustainable and rewarding for attendees. While the AAG strives to conserve meeting expenses in the most efficient manner possible, inflationary pressures, such as those driven by tariffs impacting meeting-related costs and California sales and use taxes, presented a challenge this year. The combination of planning and contracting ahead helped AAG absorb some of these costs.
We realize that it may feel that registration fees are high; the break-even model for pricing is meant to provide you with the services the membership has asked for and expects (refreshments and meals, hybrid options, childcare, and accommodations for disabilities, among others) and to assure that the meeting is a quality event and a positive experience for all.
Please feel free to reach out to me or Gary Langham, AAG’s Executive Director with questions, comments, or concerns. Send your comments and questions with the subject line “Treasurer’s Corner” to helloworld@aag.org.
Share
Register for Free
Create an account to get free access to exclusive AAG content.
AAG Members get exclusive access to publications, prominent journals, unique advocacy, grant, scholarship and professional opportunities with access to industry focus communities, and event discounts, including our annual meeting.
Some content may only be accessible if you belong to specific Specialty or Affinity Groups. You can still update your membership below. You will need to go through the Join flow, but you do not need to repurchase your membership unless it is expired or about to expire.
To provide the best experiences, we use technologies like cookies to store and/or access device information. Consenting to these technologies will allow us to process data such as browsing behavior or unique IDs on this site. Not consenting or withdrawing consent, may adversely affect certain features and functions.
Functional
Always active
The technical storage or access is strictly necessary for the legitimate purpose of enabling the use of a specific service explicitly requested by the subscriber or user, or for the sole purpose of carrying out the transmission of a communication over an electronic communications network.
Preferences
The technical storage or access is necessary for the legitimate purpose of storing preferences that are not requested by the subscriber or user.
Statistics
The technical storage or access that is used exclusively for statistical purposes.The technical storage or access that is used exclusively for anonymous statistical purposes. Without a subpoena, voluntary compliance on the part of your Internet Service Provider, or additional records from a third party, information stored or retrieved for this purpose alone cannot usually be used to identify you.
Marketing
The technical storage or access is required to create user profiles to send advertising, or to track the user on a website or across several websites for similar marketing purposes.
 The GIS Certification Institute (GISCI) Board of Directors has welcomed Jennifer L. Whytlaw, Ph.D., GISP, associate professor of Applied GIS at Old Dominion University, as the newest representative of the American Association of Geographers (AAG). She joins Darcy Boellstorff, who recently renewed her term as AAG’s second representative on the board.

 This is the last message by outgoing 2024-2026 Council Treasurer Antoinette WinklerPrins. In her earlier series, she helped illuminate several financial dimensions of a professional organization such as the AAG. In this column, she shares a visualization of the income and expenses flow of the AAG’s Annual Meeting.