October 15, 1931-September 15, 2024
The mountain geography community mourns the passing of one of its most significant exponents, the bearer of a monumental scientific world in favor of mountain research and development worldwide. Jack D. Ives died on September 15, 2024, at age 93.
As academicians Vladimir Kotlyakov and Yuri Badenkov (2024) indicated, “Professor Jack Ives is a living legend of mountain geography in the second half of the 20th century and the beginning of the 21st. His name is well known not only among scientists, politicians, public figures, but the inhabitants of many mountain settlements of the world, from the Himalaya and Pamir to the Andes and European Alps, from Scotland and the Caucasus to Iceland and China.” In 2015, Bruno Messerli said that Jack “devoted his life not only to mountain research, but also to mountain development, on behalf of the people and communities living in mountain areas.” He drew attention to the plight of indigenous peoples living in mountainous regions and advocated for their inclusion in policy-making processes concerning their lands and resources. His work went beyond academia, influencing international policy on the livelihoods and rights of mountain people.
Jack Ives’ long-term work at the International Geographical Union has played an important role in shaping the global discourse on mountain environments. In 1972 he took over the chairmanship of the Commission on High Altitude Geoecology from then-president Carl Troll, who had established the Commission during the 1968 International Geographical Conference in New Delhi. Jack then alternated with his colleague Bruno Messerli until 1996. This role drew him increasingly into mountain studies. He left an indelible mark within the IGU, in promoting geographical research on mountains and sustainable development. Under his leadership, the Commission focused on interdisciplinary research and worked to improve global understanding of the importance of mountain ecosystems. In this context, in the 1970s Ives became particularly interested in environmental issues in the Himalayas. The increasing international focus on environmental degradation in mountainous regions, such as deforestation, soil erosion and the impact on local communities, led him to advocate for sustainable mountain development. His 1989 book The Himalayan Dilemma: Reconciling Development and Conservation, co-authored with colleague Bruno Messerli, challenged the prevailing understanding of environmental degradation in the Himalayas and changed the trajectory of conservation policy in the region. This work marked a turning point in mountain research and policy and established Ives as a leading figure in the advocacy of mountain sustainability. He played an important role in making mountains a key element in global environmental policy, especially at the Earth Summit in 1992. He was instrumental in shaping the globally recognized “Mountain Agenda” for UNCED at Rio. This agenda called for greater attention to mountain ecosystems and their importance for biodiversity, water resources and human livelihoods. His efforts helped to establish the concept of “sustainable mountain development”, which remains a guiding principle in the field today. Since then, his leadership brought mountain issues to the forefront of the global environmental agenda.
His name is linked to the creation of the International Mountain Society (IMS) and the leading journals of the discipline: Mountain Research and Development, and Arctic, Antarctic, and Alpine Research. He developed “Project 6 (Mountains) of the UNESCO Man and the Biosphere” on “Human Impacts on Mountain Ecosystems” with Bruno Messerli and were key in catalyzing a group of mountain geographers into what he called amicably “the Mountain Mafia” as the movers-and-shakers for the advocacy that culminated incorporating Chapter 13 (Mountains) within the United Nations’ agenda for sustainable development (Agenda 21). They also coedited a book considered by most mountain geographers as the “bible” for mountain studies at the global level in 1997. Mountains of the World: A Global Priority became the framework to start conservation projects, academic projects and international organizations in favor of mountains. The book was translated to many languages with regional appeals. They were also key in formulating the UN-declared 2002 as the “International Year of Mountains” and thereafter November 11th, as “International Mountain Day.”
Jack D. Ives’ numerous studies and pioneering initiatives with the United Nations Environment Programme (UNEP), the Mountain Agenda including the International Union for Conservation of Nature (IUCN), ICIMOD, and FAO have been instrumental in shaping international policy on mountain conservation, and his work within the IGU has helped to raise awareness of the academic importance of mountains in global development agendas, drawing attention to the unique challenges facing mountain ecosystems and communities worldwide. He has been honored with many awards, including the King Albert I Gold Medal (2002), the Royal Geographical Society Patron’s Medal (2006), the Icelandic Knight’s Cross of the Order of the Falcon (2007), and two separate Distinguished Career Awards from the Association of American Geographers. The inaugural Sir Edmund Hillary Mountain Heritage Medal Lifetime Achievement Award (2015) was presented to him to recognize lifetime achievement in mountain research and development.
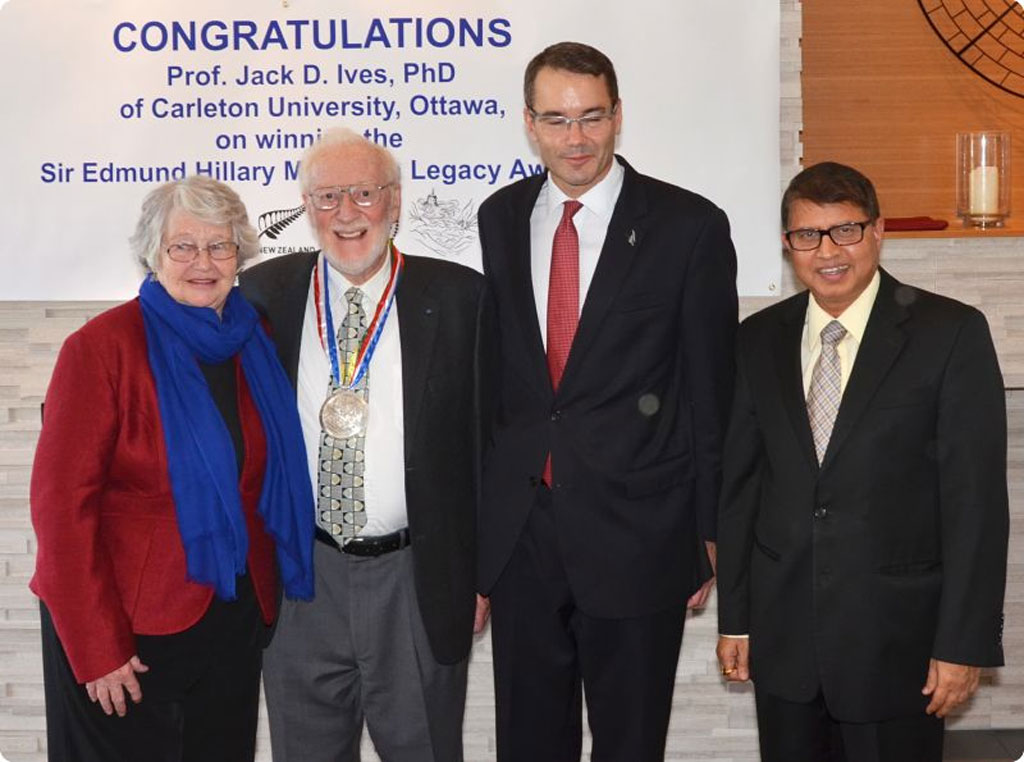
Presentation of 2015 Lifetime Achievement edition of the Hillary Medal, October 29, 2015. L to R: Pauline Ives, Jack Ives, Simon Tucker, New Zealand High Commissioner to Canada, Kali Prasad Pokhrel, ambassador of Nepal to Canada.
He received the Honorary Membership to the Commission of Mountain Studies with a diploma conferred at the 35th International Geographical Congress in Dublin, Ireland just this past summer in 2024, recognizing his fertile and restless work on mountain research and studies. The Diploma, decorated with a gaze from Alexander von Humboldt (Jack’s inspiration) recognizes his pioneering spirit and fruitful work, which will continue to illuminate the path for future montology.
Jack had been the one to suggest the laying of a bronze plaque honoring Humboldt as “the father of Montology” on a cairn at the snowline of Mt. Chimborazo in Ecuador, in December 1998 after the III International Symposium of the Andean Mountains Association (AMA). Indigenous community members, along with Christoph Stadel, Larry Hamilton, Maximina Monasterio, Robert Rhoades, Fausto Sarmiento, the Chimborazo Fauna Reserve administrators, and others, shared in Jack’s admonition that could well be the corollary of his monumental and passionate lifelong advocacy: “For a better balance between mountain environment, development of resources, and the well-being of mountain peoples.”
Colleagues and those who worked closely with him often emphasized his generosity, both in terms of his time and his willingness to mentor and support young mountain geographers. They also admired his ability to blend scientific research with activism as he sought to bring practical, policy-oriented solutions to the environmental problems he studied. It is comforting to know that many of his students, following the exemplary work of this giant, helped to cement transdisciplinary mountain research and study, becoming themselves champions of mountain geography works. Many of them are already retired from teaching, but proudly continue Ives’ model inspiring mountain lore contributing effectively to enrich the genealogy of montology with their emeritus wisdom. After Ives’ retirement, as scholarly recognition of brilliant mentors in academia, a Festschrift was published in his honor (Mainali & Sicroff, 2016) with an apropos title: Montologist.
Now that the discipline of Montology has been firmly positioned as the transdisciplinary mountain research and study, the image of Jack D. Ives will be forever reflected in the deep understanding of mountains as socioecological systems, where consilience and convergence favor decolonized scholarship of mountains, integrating the local knowledge and making real the critical biogeography and political ecology of the many dilemmas that still pervade militarized, marginalized, and exploited mountain communities in the world’s mountainscapes (Sarmiento 2020). It is with a heavy heart that the Commission of Mountain Studies of the International Geographical Union received the news of his passing, but it is with a hopeful spirit to commit maintaining Jack D. Ives’ lofty goals for the mountains alive and well!
References
Kotlyakov V.M., Badenkov Y.P. (eds). 2024. “History and evolution of the UNESCO MAB-6 mountain project human impact on mountain ecosystems: From ecology to montology.” Preface by Jack D. Ives to the book. Mountain Regions of Russia at the Turn of the Century: Research and Development. Problems of Geography Series, volume 158. Moscow: Media Press.
Mainali K, Sicroff S (eds). 2016. Jack D. Ives, Montologist: Festschrift for a Mountain Advocate. Himalayan Association for the Advancement of Science. pp. 94–97. ISBN 978-9937-0-1567-7.
Sarmiento, F.O. 2020. Montology Manifesto: echoes towards a transdisciplinary science of mountains. Journal of Mountain Science, 17(10): 2512-2527. https://doi.org/10.1007/s11629-019-5536-2.
This memorial was prepared by Fausto Sarmiento, Professor of Geography and Director of the Neotropical Montology Collaboratory at the University of Georgia; Neslihan Dal, Lecturer, Department of Architecture and Urban Planning at Burdur Mehmet Akif Ersoy University; Alexey Gunya, Professor of Geography at the Russian Academy of Sciences; and Christoph Stadel, Emeritus Professor of Geography, at the University of Salzburg.

 This is the third in a short series of perspectives by 2024-2026 Council Treasurer Antoinette WinklerPrins, a series designed to help illuminate some of the financial challenges a professional organization such as the AAG faces.