John D. Nystuen

Professor John D. Nystuen, Ph.D., 91, of Ann Arbor Michigan, passed away on July 2, 2022 at his long-time home on Olivia Avenue in Ann Arbor.

After graduating from Oroville High School in Northern California in 1948 he moved to Berkeley and the University of California, completing a Bachelor of Arts degree in Geography in 1953. Immediately after graduating, he finished ROTC training as a Second Lieutenant in the Army Artillery, serving two years at Misawa Airbase in Northern Japan. In 1955 he earned a Master’s degree and Doctorate in Geography from the University of Washington in Seattle. John’s professional career began in 1959 at the University of Michigan in Ann Arbor in the Department of Geography, and later he worked in the Taubman College of Architecture and Urban Planning. John educated a world of doctoral students. He was the chair for more than 70 Ph.D. students from around the globe. Many of his students comment on how much they learned from him and how supportive and caring they found him to be in their intellectual development. Indeed, Gwen notes how John often said that he had learned a lot from his students, as well. He was a master of the one-on-one educational experience. He implemented his belief in interactive educational interchange long before it became fashionable.

John was a leader not only in the mentoring arena but also in the research arena. As one of the first ‘space cadets’ in the quantitative revolution in geography, originated at the University of Washington in Seattle, John retained a lifelong curiosity not only about traditional geographic inquiry but also about the role of the geographer in studying evolving dynamical systems as applied both on the Earth and in the heavens above.

He published numerous books and articles with citations available in major citation indexing services. Many of his publications are archived in Deep Blue, the online persistent digital repository of The University of Michigan. He served in advisory capacities on academic boards specific to mathematical geography (first on that of the Michigan Interuniversity Community of Mathematical Geographers and subsequently on that of the Institute of Mathematical Geography).

In the early 1960s John and Gwen, his wife, met with the seven Sierra Club members who lived in Ann Arbor (out of the 40 who lived in Michigan). They began meeting regularly, going on outings, and working on conservation issues. John was active in recruiting students and faculty from his and related departments. By 1967 they had a large enough membership to become a local Sierra Club group and ultimately formed the state chapter in Michigan. Over the succeeding years, John continued his work on local and state issues — contributing to our local Natural Features Inventory and supporting Gwen in an amphibian survey in local ponds. John also contributed his photography and sketching skills to many local conservation efforts.

John is survived by his wife of 67 years, Gwen Nystuen, and their daughter, Dr. Leslie Ann Nystuen, M.D. [Peter Leopold], sister-in-law Gaile Hoffman [Augustus] of Oakland, California, and nieces and nephews in California, Washington, New Mexico, Canada and Australia.

    Share

Nikolas Smilovsky

Education: Ph.D. focus on Behavioral Geography and Environmental Perception (Grand Canyon University) M.S. in Geographic Information Systems (Arizona State University), B.A. in History (University of Florida) 

The following profile was compiled by Brendan Vander Weil (Texas State University) for the Encoding Geography initiative. To learn more, visit: https://www.ncrge.org/encoding-geography/


Please describe your job, employer, and the primary tasks you perform in your position.  

I work for a technology company that primarily produces integrated global navigation satellite system (GNSS) solutions for organizations around the world. Bad Elf, LLC is a leader in the global positioning market, being one of the first companies to productize GPS devices that plug into smart devices, a new type of technology referred to as the “bring your own device” market.  As the Director of Geospatial Solutions, I specifically work with customers that have field data collection needs. I help put together best practice training sessions and solutions for their organization based on specific needs. Working with various stakeholders, I ensure success whether that is profitability, time savings, or other more altruistic goals.    

What geographic knowledge, such as terminology and concepts, is important and useful to know in your line of work?  

Having a general understanding of geographic concepts is important, because all of my customers, clients, and partners are involved with something geospatial. It is also important to understand the technology associated with geography. For example, understanding geographic information systems (GIS), computer-aided drafting and design (CADD) software, light detection and ranging (LiDAR) hardware, or unmanned aerial vehicles (UAVs) aka drones have more applicability for Bad Elf. Additionally, understanding the science and math aka geodesy, underneath the geographic concept is paramount.  

What procedural geographic knowledge, such as spatial analysis using GIS or collecting spatial data, is important for you to know?  

Being able to leverage Bad Elf data collection devices to populate geodata repositories is what we do daily. One of my roles is to support customers that have goals of collecting high fidelity field data. This data is often used in analysis and or geographic inquiry. For example, I work with universities, government agencies, national laboratories, engineering firms, environmental consultants, land surveyors, biologists, planners, arborists, and architects who all do some type of procedural geographic tasks.     

Can you provide an example of a project where you apply geography and computer science to analyze and solve problems related to important issues? 

While I don’t often directly deal with solving important end-game issues, I do help the people that are breaking industry chains and are doing significant research/application. In a sense, I get to support the efforts intrinsically through my support. What is also extremely important to me, is that I get to help a wide plethora of people do better geography. Every day I get to help a different industry, organization, or even country tackle their specific geospatial conundrums.    

What types of geographic questions do you ask and think about in your work? 

I deal with every type of individual, organization, or entity that completes geospatial field data collection. The amount of technology and science that we work with and integrate is expansive. If you don’t have good geospatial data, you won’t complete good work. Thus, I ensure my customers can collect amazing, authoritative data so that they can perform their downstream tasks more efficiently and confidently. I may not get all the glory for completing these projects, but that is not important. What is important is being able to collect good data!   

What types of data did you acquire to support your work?  

Our GPS devices natively collect latitudinal, longitudinal, and elevational values, along with geodetic metadata associated with the acquisition of the spatial coordinates. Additionally, our devices are integrated into utility locators, which detect underground systems of infrastructure; laser rangefinders that help collect offset locations like tree heights; and most drones/LiDAR systems which collect remotely sense data like aerial imagery, point clouds, radiation, and non-visible light spectrums, and temperature.   

What types of knowledge and skills, both geographic and general, do you use to evaluate, process, and analyze the data you gather for your work? 

Mostly GIS software packages like Esri ArcGIS Pro or Q-GIS are used to evaluate the data procured by the Bad Elf devices. Additionally CAD programs like AutoCAD Civil 3D and BIM programs like Revit are used for modeling purposes. Additionally, we use computer programing languages like Python to manipulate the data.   

How do you communicate the results of your work? Do you have a recent product or publication to share with us as an example?  

We mostly make quantitative maps and spreadsheets showing our data and how they compare to other datasets. Our clients use hundreds of different methods and applications to complete this process. A perfect example of a customer using Bad Elf, Esri, Go Pro Cameras, tablets, and e-bikes to collect utility data is this case study from the town of Cave Creek, Ariz. 

How do you view your work in relation to civic engagement and issues that you care about?  

I engage daily with both the private and public sectors of our society so that they can better complete the tasks they set out to do. I eat, sleep, and dream geospatial. Every day that I get to engage in helping people do better spatial tasks is a great day.  

How does your career align with your values and aspirations in life now and back when you were a student?  

I feel very blessed because my employer and my values align extremely well. Aligning well with your organization is extremely important for your happiness and growth, but also for the organization to be successful. My father always said, “Nik you will eat a lot in your life, so enjoy your food. You will also sleep a lot, so enjoy your bed. Lastly you will work the most, so make sure you love your job!”  


This material is based upon work supported by the National Science Foundation under Grants No. 2031418, 2031407, and 2031380 (Collaborative Research: Encoding Geography – Scaling up an RPP to achieve inclusive geocomputational education). Any opinions, findings, and conclusions or recommendations expressed in this material are those of the author(s) and do not necessarily reflect the views of the National Science Foundation 


    Share

Wayfinding: A Map to Inspire Local Journeys 

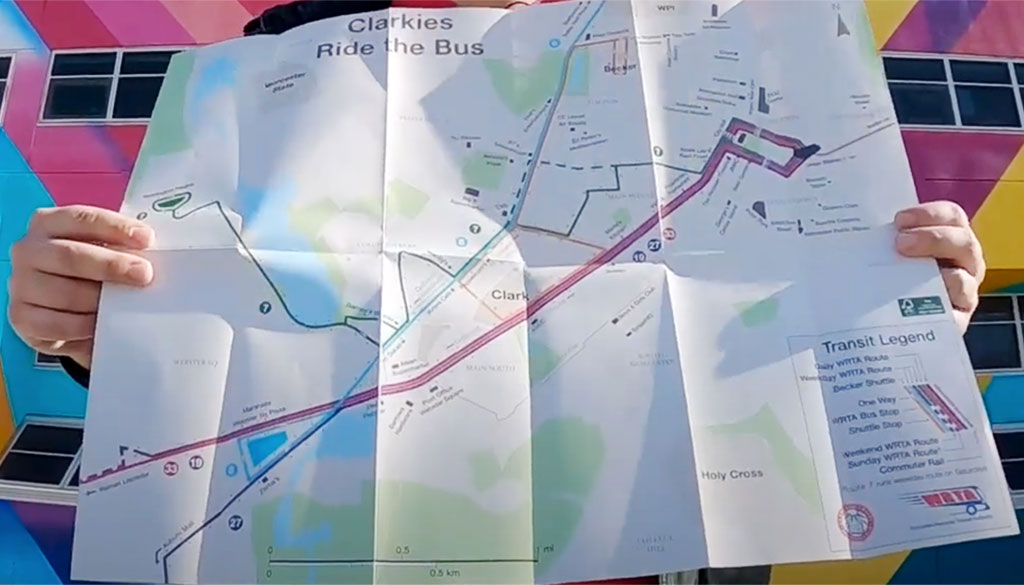
Geography and urban planning Ph.D. student Nick Mellis shows his walking and transit map of Worcester, Mass.

Grad Student Nick Mellis’s pocket map of Worcester is a passion project

Photo of Nick MellisWhen Nick Mellis was eight years old, he memorized the New York City subway map. He’s been a map and transit enthusiast ever since, majoring in geography as an undergrad at Clark University, and going on to pursue graduate studies in community and urban planning, also at Clark.

In 2020, Mellis launched a project to acquaint his fellow “Clarkies” with the transit system, sights, and open spaces of the university’s home of Worcester, Massachusetts. Mellis researched the best practices of tourism maps, hosted community discussions — and walked, biked, and rode the city’s trains and buses — a lot. The result is a map showing transit routes on one side, recreation and outdoor areas on the other — an especially welcome tool for respite from studies during the pandemic.

“I go on really long walks. It’s my way to de-stress,” Mellis told ClarkNow. “Part of the reason that I wanted to go to all the trails on the map was because I like exploring new places around the city.”

He also sees the project’s response to climate change, encouraging people to seek outdoor locations via public transportation. He observed that many of the students at Clark don’t know where green spaces are, nor how to access them:

A way to get more people around the city and on the bus is to make a map.

Mellis worked with a map printer in Denver to publish 2,500 copies of the map, which are available across campus.


Read more about Nick Mellis’s work at ClarkNow.

Find out about AAG’s network of graduate students at the Graduate Students Affinity Group

    Share

Suparna Das

Education: Ph.D. in Geography (University of Utah), M.A. in Regional Planning and Development (Jawaharlal Nehru University), B.S. in Geography (University of Calcutta) 

The following profile was compiled by Brendan Vander Weil (Texas State University) for the Encoding Geography initiative. To learn more, visit: https://www.ncrge.org/encoding-geography/


Please describe your job, employer, and the primary tasks you perform in your position.  

I’m currently responsible for supervising an expanding group of talented statisticians, behavioral health scientists, data analysts and epidemiologists. Together we manage data collection efforts, disseminate various products (reports, publications, briefings, policy documents) and advise behavioral health policies for the administration. The Treatment Services Branch (TSB) is responsible for three major behavioral health data collection and surveillance systems: Drug Abuse Warning Network (DAWN) and Behavioral Health Information Surveillance Systems (BHSIS) and provide all statistical support for Buprenorphine Waiver Notification Systems (BWNS).  

Before joining SAMHSA in March 2021, for close to seven years I was working as the statistician and viral hepatitis epidemiologist for DC Department of Health (DOH). I was also part of the COVID-19 Task force for DC from 2020–2021. 

How has your education/background in geography prepared you for this position? 

Geo-computation, from my understanding, is the “art and science of solving complex geographical (spatial) problems through computation” (Source unknown). I want to take this opportunity to iterate that Geographical Information Systems (GIS) and Geographical Information Sciences (GISc) are NOT interchangeable. I strongly believe that we as geographers can do a lot more than make maps. This belief has been the central tenet of my career in public service. We can assist decision-making in the most scientific method with our understanding of space and spatial changes over time.   

As a graduate student in India (Jawaharlal Nehru University (JNU)) and the U.S. (University of Utah), I was lucky to have received extensive training as a spatial scientist and demographer. This expanded my understanding of population sciences and geo-computation, which I apply every day in my position to improve health outcomes for people. 

What is an example of applying geography concepts and skills in order to analyze and solve problems in your work? 

I have several projects that are currently being implemented where I am using geo-computational methodologies, but we will have to wait for them to be released through SAMHSA. For me, it is impossible to resolve mental health and substance abuse disparities and encourage health equity without spatial thinking and geo-computation. SAMHSA (specially CBHSQ) understands that and encourages discussion on applying geo-computation while also supporting and encouraging researchers to use https://findtreatment.samhsa.gov/ for analytical and geo-computational purposes, among many other projects.  

From my previous position at DC DOH, where I spent close to seven years, I was able to implement several geo-computational projects. I published as much as I could to make sure people knew about administrative data collection and the impact of geo-computation in policy. One project example is DC’s effort to End the HIV Epidemic (EHE).  

I was proud to have been an integral part of the EHE implementation with the DC DOH, which has achieved the first of its 90/90/90 goals (https://www.dcendshiv.org/) of 90% of people living with HIV being aware of their HIV status (and now aiming for 95%). We were committed to implementing evidence-based policies to improve care for people living with HIV and create access to prevention and tools to stop new infections.   

I used spatial analysis to find high-risk areas that needed immediate attention, resource re-allocation, and Pre-Exposure Prophylaxis (PrEP) to reach the EHE goals. I was responsible for monitoring and evaluation (M&E) of Centers for Disease Control and Prevention’s Social Network Strategy (SNS) to identify new HIV diagnoses for DC.  

For M&E, I was responsible for programmatic data collection, program monitoring, evaluating the programs and the outcomes, providing technical support and assisting in resource allocation. I then mapped the outcomes for the community-based organizations (CBOs) for improvements. The project was instrumental to a separate proposal for using geolocation-based applications to identify new HIV diagnoses for states to implement.  

What types of geographic questions did you ask and think about in your project? 

My questions as a public servant always have a two-tier approach:  

In the first tier: What is the impact of my project on the lives of people and what outcome do I want to answer through this project. I restrict my projects to non-exploratory but policy-oriented questions.  

In the second tier: My projects span demography, GISc and spatial epidemiology or health geography. I do not have any projects or have been part of any project that does/did not entail extensive statistical/data management-based coding.  

What types of data did you acquire to support your project?  

I always use administrative data collection for my projects within my role as a public servant. These data collection tools inform policies within the administration. I encourage researchers in academic settings to use them as well. There are several administrative data sets available which can be instrumental in framing accurate questions. I also encourage researchers to read annual reports to understand their needs. SAMHSA has several such data collection efforts which are publicly available through public use files https://www.samhsa.gov/data/ 

What types of content knowledge and skills (both geographic and more general) did you use to evaluate, process, and analyze the data you gathered for your project? 

A large part of my job is to make sure that administrative data is collected without any glitches and plan how to enhance data collection so that it will assist health related policies in the United States. The scope of each ongoing project is different, thus, as a supervisor, my job is to assign it to the appropriate subject matter expert (SME) who would be responsible to evaluate, process and analyze the data.  

As for projects that I take interest in, they are ones that have a large spatio-temporal aspect to it or have predictive capacity.  

How did you communicate the results of your project (e.g., writing technical reports, making maps and geo-visualizations, creating graphics, data tables, etc.)? Do you have a recent product or publication to share with us as an example?  

I have communicated my results to multiple stakeholders, ranging from scientific audiences, panels, political stakeholders, community-based organizations, legal groups, media (including interviews), administrative leaderships, and the public. The communication strategies I use differ based on the audience. I have generated reports, technical documentation, maps for program evaluation for resource allocation, publications, and conference proceedings.  

What are the criteria that you use to assess the quality of your results?  

I look at the impact of my project on improving health outcomes for people and its scientific validity – in other words, I’m looking at the impact of my results on implementing evidence-based policy. 


This material is based upon work supported by the National Science Foundation under Grants No. 2031418, 2031407, and 2031380 (Collaborative Research: Encoding Geography – Scaling up an RPP to achieve inclusive geocomputational education). Any opinions, findings, and conclusions or recommendations expressed in this material are those of the author(s) and do not necessarily reflect the views of the National Science Foundation 


    Share

Tracy Whelen

Education: M.S. in Geography (University of South Carolina), B.A. in Geography (Mount Holyoke College)  

The following profile was compiled by Brendan Vander Weil (Texas State University) for the Encoding Geography initiative. To learn more, visit: https://www.ncrge.org/encoding-geography/ 


Please describe your job, employer, and the primary tasks you perform in your position. 

I am a Geospatial Consultant and participant in the Business Insights & Analytics Leadership Development Program at Travelers Insurance. Travelers is a leading property and casualty insurance company, offering a wide range of personal and business insurance products primarily in the United States and Canada. 

I recently completed an enterprise rotation in Enterprise Data & Analytics, working on data management and quality assessment of enterprise geospatial datasets and ad-hoc geospatial business consulting requests.   

I am currently in a rotation for Claim Business Intelligence & Analytics. My work includes geospatial information delivery and analysis for Claim senior leadership and field offices. Part catastrophe response, part improving everyday claim handling processes.  

Prior to joining Travelers, I received bachelor’s and master’s degrees in geography (Mount Holyoke College and University of South Carolina, respectively). In between my degrees I worked as a GIS Specialist in a remote sensing lab at University of Massachusetts, Amherst.  

How has your education/background in geography prepared you for this position? 

All the data I work with has a spatial component to it, and we often work with thousands (sometimes millions) of records at a time, necessitating strong geography and computer science skills to efficiently store, process, and analyze data, and to deliver actionable outputs.  

Relevant courses from my education that I use today in my job include: 

Geography 

  • GIS/spatial analysis (intro and advanced)  
  • Remote sensing 
  • Spatial modeling  
  • Web GIS  
  • Basic human and physical geography 
  • Electives: Meteorology, hazards geography, business geography 

Computer Science 

  • Introductory scripting (if statements, loops, functions, etc.) 
  • Python 
  • SQL 
  • Data structures 
  • UI/UX design 
  • Javascript (web app development)  

Math 

  • Discrete math (basic logic and set theory)  
  • Statistics (non-spatial and spatial) 

What geographic skills and information do you use most often in your work?  

Geographic concepts that I use in my daily work are important for things such as asking what business problems have a spatial component to them or analyzing the spatial relationship between two or more datasets (e.g. spatial joins and other geospatial analysis). I also need to understand a wide variety of spatial data formats, how to convert between them, and what formats are most appropriate for a given use case (e.g. basic raster and vector formats, enterprise SQL databases, APIs, published feature services, etc.). Finally, I need to know when to use geographic coordinates versus a projection (and what an appropriate projection might be).  

What is an example of applying geography concepts and skills in order to analyze and solve problems in your work? 

One of the many risks Travelers seeks to mitigate are natural hazard events, such as wildfires and hurricanes that climate change may make more extreme. Sustainability at Travelers means performing today, transforming for tomorrow and fulfilling our promise to our customers, communities and employees. Where these two come together is how our Claims department responds to natural hazard events, especially large wildfires or damaging wind events. The following videos capture the spirit of what we do, and the geospatial component of Claims catastrophe response. 


Note that Travelers is organized along an Agile structure, with cross-functional teams continuously delivering improvements. While there are always new products and applications being developed, there are also lots of long-term operational systems being continuously used and improved upon. Often employees build on past work and may not see a large project or system from beginning to end. My team’s catastrophe response work is an example of this type of long-term system, and my answers are on behalf of the team.  

What types of geographic questions did you ask and think about in your project? 

The broad business question underlying this issue is, “How can we optimally respond to catastrophe events, meeting customer needs with the most efficient use of business resources?” Underlying questions include: 

  • What location has been/will be impacted? 
  • What is our exposure in the area? (i.e. number of policies, associated financial exposure) 
  • Where have claims already been reported? 
  • How many claims might we expect? 
  • What types of claims do we expect to see from this event? (e.g., wind, water, fire, etc.) 
  • What types of damage occurred, and how severe is the damage? 
    • Will this impact our ability to respond, either because an area is inaccessible or because local offices or employee homes have been damaged? 
  • Where can we acquire the necessary data from? 
  • Can we develop models to more efficiently review post-event imagery as part of the catastrophe response process? 
    • If so, what features are we trying to spot in the imagery?  
    • How does this vary by event type? 
    • What might be appropriate modeling algorithms to use? 
    • What are some of the challenges the model might encounter? 

My team does not directly answer all these questions, but we need to be able to provide appropriate data to the senior leadership and other decision makers or support staff who can build a final answer.  

What types of data did you acquire to support your project? 

  • Business data (e.g. claims, policies) 
  • Event data – wildfire boundaries, hurricane wind footprints, precipitation measurements, tornado damage reports, etc. 
  • Aerial imagery and derived model output 
  • Property geometry data (e.g. building footprints, parcel boundaries)

What types of content knowledge and skills (both geographic and more general) did you use to evaluate, process, and analyze the data you gathered for your project? 

In the moment skills that we use on this project for responding to a single catastrophe event include: 

  • Querying databases (spatial and nonspatial joins, filters) 
  • Combining and reformatting a variety of data formats  
  • Running models in python scripts 
  • Common sense/data quality checks 

For long-term projects, the output of which gets used in catastrophe response (multiple team effort), the skills we use are: 

  • Internal model development in partnership with data scientists  
    • Curate input data (image locations, image clipping geometry, training data, etc.) using SQL and python 
    • Evaluating model results against other sources of truth 
  • Evaluating new 3rd party datasets (accuracy, timeliness, availability, cost, other potential sources for the same information)

How did you communicate the results of your project (e.g., writing technical reports, making maps and geo-visualizations, creating graphics, data tables, etc.)? Do you have a recent product or publication to share with us as an example? 

We publish web GIS content as both data layers and maps, creating different versions for different user groups in order to control access to sensitive information. We also use frequent email communication, whether it is one on one, small group with specific questions and answers, or larger list-serv communications (with standardized templates) at key time points during catastrophe response (e.g. web map published, imagery collected, etc.). Additionally, we communicate results through spatial SQL data pulls (tabular format)  

See the below list for examples of broader enterprise or external communications about projects and programs mentioned in this interview. 

  • Travelers 2021 Q3 Earnings call. Note CEO Alan Schnitzer’s introductory remarks including, “location intelligence at the parcel level” and our “AI Assisted Claim Damage Detection Model was a key part of our Ida claim response” 
  • Interview of Adam Sobek (Travelers AVP of Geospatial) at NearMap Navig8 Conference 2020 (Travelers’ use of imagery, including for catastrophe events) 

What are the criteria that you use to assess the quality of your results?   

Most important criterium: Has the business need been met?  

Other important criteria: 

  • Validate data quality 
  • Spatial scale and level of accuracy  
  • Minimizing false negatives, minimizing false positives.  
  • Minimizing process (time, number of steps)

The business need at hand dictates which criteria are important, which varies from question to question. Examples include: 

  • Level of address accuracy needed to plot individual policies versus summarize at a zip code level 
  • Some analytics results are only valuable if they can be completed faster than more manual processes out in the field. 

This material is based upon work supported by the National Science Foundation under Grants No. 2031418, 2031407, and 2031380 (Collaborative Research: Encoding Geography – Scaling up an RPP to achieve inclusive geocomputational education). Any opinions, findings, and conclusions or recommendations expressed in this material are those of the author(s) and do not necessarily reflect the views of the National Science Foundation 
    Share

Community Geographies Collaborative

Geography Graduate Students Networking Workshop

Preparing to be a Professional

Finding and Applying for Jobs in International Setting

Best Practices for US Government and Private Sector Job Applications & Interviews: Owning Your Story