Embracing geography as an international discipline

In an increasingly multi-polar world, rife with resurgent ethno-nationalist and isolationist tendencies, geography needs to emphasize its international perspectives and connections, not pull back from them or play them down. While geography may be a relatively small discipline in the United States, its strength is its grounded understanding of our intensely interconnected world and its global reach as a field of study.
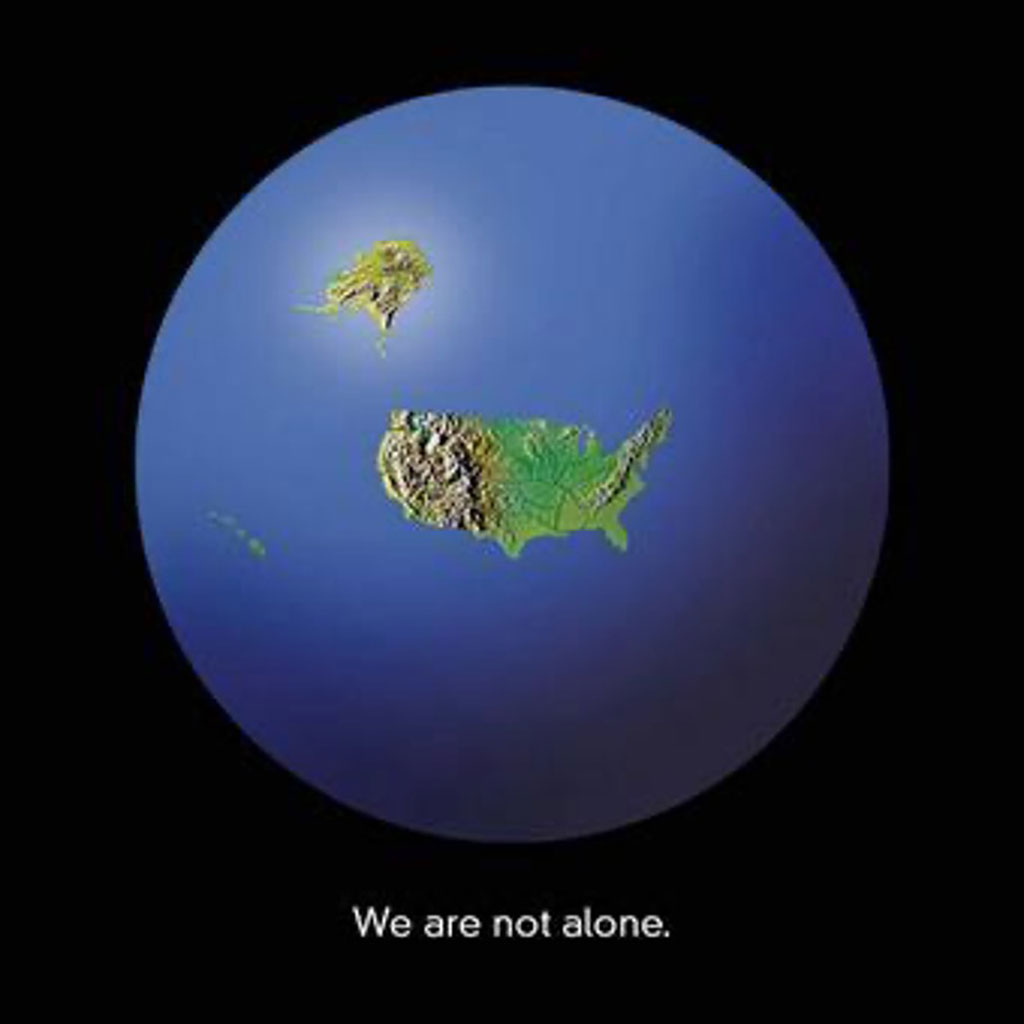
The U.S. has a long history of isolationist tendencies, based in part on the fiction that we can wall ourselves off from the rest of the world (Figure 1). What this ignores are the myriad of ways in which we are connected to other parts of the planet, both historically and in the present. Geographers are exceptionally good at explaining and theorizing these connections and this must remain a bedrock of geographic scholarship and teaching.
The view that countries can exist in isolation is problematic and counterproductive. It contributes to zero-sum game thinking, the idea that one group or country loses if another wins. A nuanced geographic understanding of the world challenges this view by highlighting the many ways one place on the planet is connected to others in terms of material and cultural flows, as well as shared environmental phenomena. In many cases, the world is a global commons. In seeking to maximize our own return, we often undermine our collective well-being.
I would argue, and researchers have shown, that publics educated in geographic perspectives better understand the inter-connected nature of the world and that we have a shared interest in working together. This has policy implications from the local to the global scale, be it SNAP (formerly known as Food Stamp) benefits for the hungry person next door or emergency food assistance for someone on the other side of the planet. We help our neighbors not just because it is the right thing to do, but ultimately because it is also in our shared self-interest. As the late Minnesota senator Paul Wellstone used to say: “We all do better when we all do better.”
We help our neighbors not just because it is the right thing to do, but ultimately because it is also in our shared self-interest.
American geography has been constantly nourished and re-invigorated by its international connections. International geography faculty and students who come to the United States to work and study contribute to the dynamism of our discipline on so many levels. In my graduate school days, for example, three of the five members of my dissertation committee and half of my student cohort were international. In my liberal arts college geography department today, roughly 30 percent of the faculty and 20 percent of the undergraduate students were born and raised in other parts of the world. Their talents, insights and energy make our discipline a cutting-edge science. This is why the actions of the current U.S. administration vis à vis international students and faculty are so deeply problematic. By harassing our colleagues and students, denying visa applications, deporting people and policing contrarian views, the current U.S. administration is undermining science writ large and especially disciplines like geography that have deep international connections. This is why the AAG signed on to a letter condemning the targeting of foreign scholars in April 2025.
Beyond our colleges and universities, scholarly exchange across national borders is critical for advancing geographic knowledge. This means welcoming foreign scholars into the U.S. for conferences and research, as well as supporting U.S.-based scholars who attend conferences and undertake research abroad.
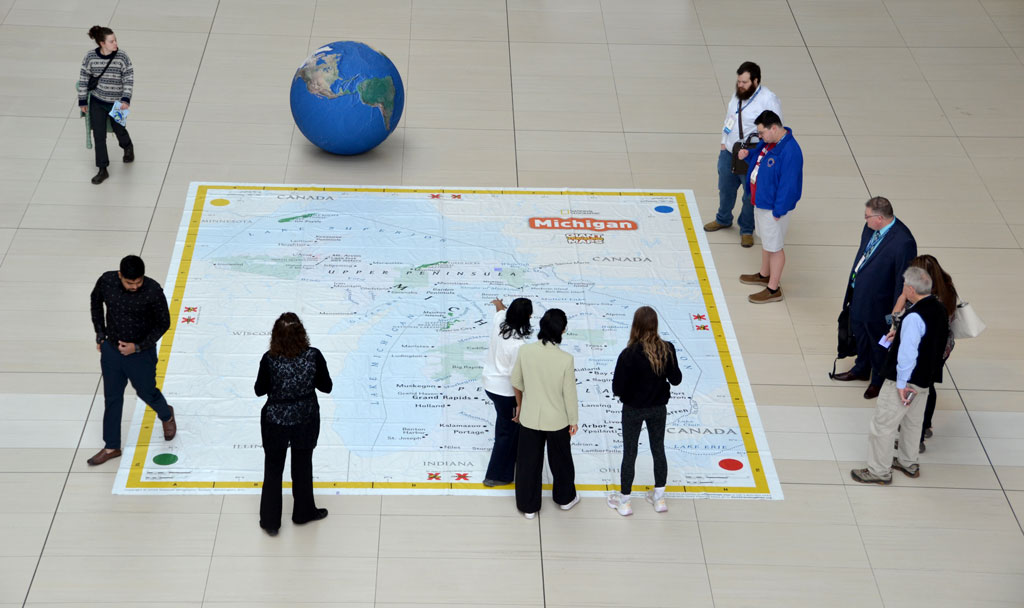
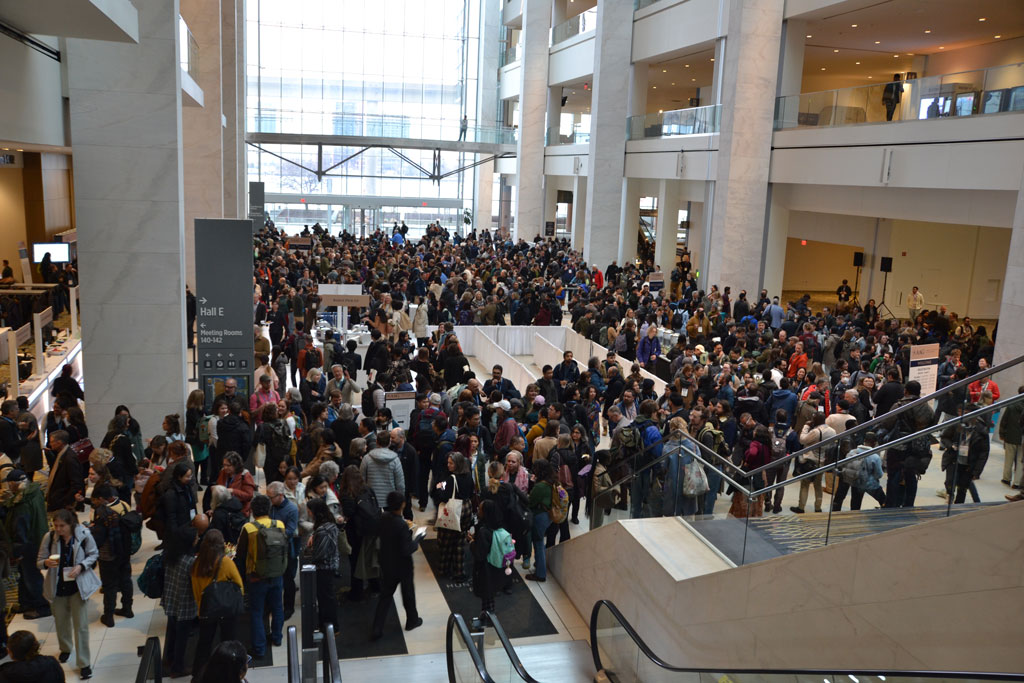
The AAG annual meeting has long been an important forum where geographers from all over the world gather to exchange ideas and advance geographic understanding. Despite the unwelcoming tone and problematic border procedures of the current administration, some 26 percent of the annual meeting attendees in Detroit came from institutions outside of the U.S. (and have averaged about 40 percent over the past 10 years). I want to personally thank those who came to the meeting and encourage you and others to come back next year. Science must transcend nationalist politics and we (the U.S. geographical community) really need your support and understanding in this difficult political moment. I also want to thank the AAG staff who worked diligently to facilitate the visits of international scholars to attend our annual meeting (by, for example, issuing letters in support of visa applications and monitoring international arrivals at the meeting). I am also proud that the AAG has programs that support international scholars, such as a discounted membership fee for those based in the Global South.
On the flipside, and acknowledging the federal funding cuts that have decimated research and travel budgets, U.S.-based scholars need to keep engaging in scientific forums outside of the U.S. One of the more obvious spaces to engage with the international geographic community is in various meetings organized under the auspices of the International Geographic Union (IGU), an international umbrella organization for national level geographic societies around the world. While the IGU holds big congresses every four years, with regional meetings in-between the congresses, I have found engagement with IGU commissions (akin to AAG specialty groups) to be especially rewarding. Many of these commissions organize smaller conferences where you really get to know other geographers and explore new regions.
Geography prospers when it leans into its international perspectives and connections. Geographers must continue to educate students and broader publics about the interconnected nature of our world. Furthermore, American geography’s secret weapon is its international linkages, from non-U.S. faculty and students, to conferences with diverse participation. The constant mixing of insights and life experiences from the across the U.S. and around the world fuels a formidable scholarly engine. We don’t build walls in geography, we reach across them.
Please note: The ideas expressed in the AAG President’s column are not necessarily the views of the AAG as a whole. This column is traditionally a space in which the president may talk about their views or focus during their tenure as president of AAG, or spotlight their areas of professional work. Please feel free to email the president directly at [email protected] to enable a constructive discussion.

 There is a strange thing that happens once you are hired or appointed to a leadership post within higher education. You, the racialized you, sit in the chair, hopefully a functional one, and the onslaught begins. The type of onslaught that no orientation program or notes from the previous seat holder can prepare you for, because they are often unprepared to actually provide any assistance to you on such matters. What matters? The matters of Race, the matters of gender, and the matters of difference. At least on matters of Race, becoming and being an administrator of color leaves you with very little insight from literature in higher education (most studies and discussions are pre-2000s: Poussaint, 1974; Wilson, 1989). More contemporary discussions have been focused on the (needed) diversification of leadership in the university (Jackson, 2003; McCurtis, Jackson, & O’Callaghan, 2009) or have been focused on pathways that were undertaken to become leadership of color in the university (Liang, Sottile, & Peters, 2016; McGee, Jett, & White, 2022; Valverde, 2003).


 For almost a quarter century, the AAG’s