Illinois Agriculture

It’s no secret, especially to its residents, that Illinois is a divided state. There’s Chicago, and then there’s not Chicago. However, Illinois’ rural farming region should not be overlooked when it comes to appreciating and understanding what makes this state tick. While calling oneself a farmer is as simple as being able to annually produce and sell more than $1,000 of agricultural goods (something my wife’s never-ending herb garden could likely do in most years), the number of farms in and around Chicagoland has increased. Since 2002, Illinois has lost just over 2,000 farms, yet the number of farms in the Chicago Metropolitan Statistical Area has increased, due in large part to the addition of smaller farms, less than 200 acres in size, that cater to the region’s ever-increasing demand for local, fresh food (more on urban agriculture in an upcoming Newsletter piece).

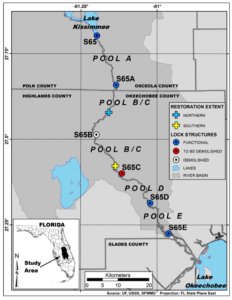
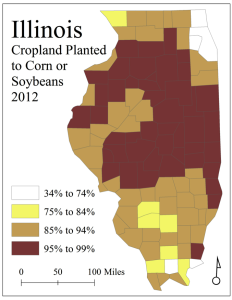
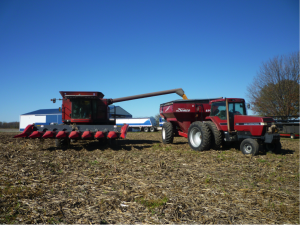
According to the U.S. Geological Survey’s 2011 National Land Cover Dataset, 70 percent of Illinois’ land cover was classified as either cultivated cropland or pasture/hay (FIGURE 1). The state ranks 7th in the U.S. in total agricultural sales ($17.2 billion), but ranks 3rd when considering only the sale of crops such as corn and soybeans, which in 2012 covered over 95 percent of Illinois’ cropland. Illinois farmers produce between 15 and 20 percent of the U.S. total combined corn/soy crop annually (FIGURE 2). East-central Illinois was the country’s first major cash-grain farming region. Known as the Grand Prairie, this region, prior to Euro-American settlement, was a large grassland/wetland/oak savannah ecosystem. Because of its lack of relief it was poorly drained and largely ignored – except for cattle barons who used the untillable land as pasture – as the state was being settled in the 1800s. As decades passed, and as drainage ditches were dug and clay field tile were installed, the productive capacity of this region’s fertile soil was eventually realized. As these large parcels of pasture were tilled, and because individual landowners could not farm it all themselves, it necessitated the beginning of the now ubiquitous system of renting privately-owned cropland to others; a system by which landowners are paid a per-acre sum by a tenant who maintains the owner’s land. In Illinois, and across much of the rest of the Corn Belt, well over 50 percent of all farmland in most counties is rented.

Figure 1. Illinois Land Cover, 2011.


Figure 2. Percent of harvested cropland planted to corn or soybeans, 2012.


Most farms in Illinois have grown over the years. Of the state’s 75,000 farms, nearly 8,000 (~10 percent) are 1,000 acres or larger. However, those 8,000 farms maintain over half of all of the state’s farmland. The idea that these big, “corporate” farms are industrializing the agricultural landscape is yarn easily spun to the uninformed, but one that is blatantly incorrect. In 2012 Illinois had 3,716 corporate farms. This seems impressive, especially when the prototypical “family farm” continues to disappear, but 90 percent of these so-called “corporate” farms were, in fact, what the U.S. Department of Agriculture refers to as “family corporations” (FIGURE 3). In other words, they were still family farms. The land was not owned by Cargill, Monsanto, or any of the other large, multinational corporations often blamed for the demise of farming (although such corporations do have considerable influence in modern U.S. agribusiness), but for tax purposes the family had decided to create a business. In reality, only 0.5 percent of Illinois farms are non-family, corporately-owned entities. These non-family, corporate-owned farms work an equally small percentage of the state’s total agricultural land – 0.7 percent. The Illinois “corporate” agricultural landscape mirrors exactly that of the entire United States: 0.5 percent of farms, 0.7 percent of farmland…numbers that have changed little over the past four decades.

Figure 3. The large-scale equipment of a family farm. From left to right: corn-harvesting combine, semi tractor/trailer (in background), and grain cart/tractor.


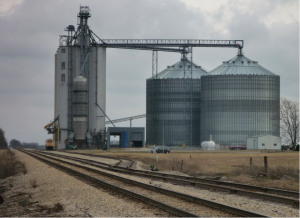
Chicago’s importance in U.S. agricultural production and processing, by and large, has waned over the past half-century. Once the center of our country’s beef (and to a lesser extent pork) processing industry, Chicago, save for a handful of specialty uses for corn-based products (e.g. high fructose corn syrup), sees little of what is produced in much of the rest of the state. If not used locally to produce biofuels or to feed Illinois’ dwindling numbers of livestock (Illinois accounts for only 1.2 percent and 6.6 percent of U.S. cattle and hog sales, respectively), most corn and soybeans are brought from the fields in which they grew to one of the many hundreds of giant, glistening grain elevators that can be found along Illinois’ railroad lines – many of which head south to out-of-state processing facilities or to ports along the Mississippi River where they will continue south for export out of the Gulf of Mexico (FIGURE 4).

Figure 4. Modern grain elevator and storage at Coles Station, between Mattoon and Decatur, IL.


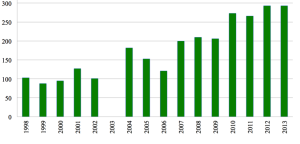
Geographer William J. Doolittle said, “Agriculture may well be the most comprehensive of geographical topics. It involves modification of both the biological and physical components of the environment, and it incorporates social and economic components with distinctive spatial manifestations” (Annals of the Association of American Geographers, Vol. 82, pp. 386-401). Agriculture and rural areas will be the focus of a number of sessions at the upcoming Chicago meeting. Indeed, many have already begun to take advantage of these topics’ increasing breadth and depth by reporting on – at AAG Annual Meetings – the myriad issues related to our rural and agricultural landscapes (FIGURE 5). We hope you will join us!

Figure 5. Number of rural- and agricultural-themed papers/posters presented at past AAG Annual Meetings.

— Chris Laingen
Eastern Illinois University

DOI: 10.14433/2014.0015

    Share

MyCOE / SERVIR Capstone Fellows Describe Their Experiences

[/media-credit] Joel Kowsky, NASA
In the spring, 14 students traveled from all over the world to Washington, D.C., to discuss their efforts using satellite data and mapping technologies to address climate change issues in their regions. The efforts are part of the My Community, Our Earth (MyCOE) / SERVIR Fellowship Program. The student-led projects address a range of issues including agricultural productivity, water resources, sea level change, food safety, forest conservation, and natural disaster planning.

The event was a culmination of a global program carried out over the past two years, with representative student-led projects highlighting how youth around the world are using remote sensing, GIS, GPS, and geospatial data to address climate change issues in their regions. The 14 students were selected from the 120 participants who were nominated by instructors and staff of the MyCOE Program and SERVIR hubs and chosen by U.S. Agency for International Development (USAID) and NASA.

View the inspiring testimonials from these fellows:

Khin Seint Seint AyeImpact of famous floating gardens on the environment and livelihoods of a unique Inle lake in Central Myanmar

Susan MalasoApplication of GIS and RS Techniques in Frost Risk Mapping for Mitigating Agricultural Losses in Kenya

LhakpaLinking Traditional Beliefs on Climate Change to Scientific Understanding: A Case Study in Eastern Bhutan

Tsedenya Abebe MengisteAssessment of Flood Frequency and Local Adaptation Practices in Dilu-Meda, Upper Awash, Ethiopia

Prasamsa ThapaSurface Area Variation and Climatology of Tsho Rolpa Glacial Lake using Remote Sensing and GIS, Dolakha District, Nepal

Jirawat PanpengVulnerability of Rural Coastal to Potential Sea Level Change: Case of Laemsing District, Chanthaburi Province, Thailand

Roseline Nijh Egra BatchaParticipatory Learning and Gender Partnerships in Climate Change and Food Security: Mfoundi-Yaounde Cameroon

Joyeeta PoddarAssessment of Glacier Health as a Response to Climate Change in Western Himalayas, India

Khoa NguyenChanges of paddy rice extent and its possible effect on the environment in Mekong Delta, Vietnam

Seble DejeneCarbon Stock Estimation in Wof-Washa Natural Forest: Carbon Finance Options & Climate Change Mitigation, Ethiopia

Pramila PaudyalClimate Change Vulnerability in Mountain Agriculture: A Case Study Of Susma Chhemawati VDC, Dolakha District, Nepal

Wasiu AlimiAssessment of the Climatic and Socio-Economic Impacts of Illegal Logging in a Rainforest: The Role of Women, Nigeria

Lateefah OyinlolaAssessment of vulnerabilities of fresh cut produce to climate change in South Western Nigeria

Tran Thi Mai AnhApplication of GIS and Remote Sensing in Administering Payment For Forest Environmental Services at Huong Son Hydroelectric Power Plant’s Watershed, Vietnam

The MyCOE / SERVIR program supports long-term training of young, emerging scholars in the use of Earth observations, geography, and geospatial technologies to address climate change issues in developing regions. The public-private partnered program provides the mentorship, networking, and professional development necessary to transform innovators into scholars, with the skills to connect their research results to the public and decision makers. It is sponsored by NASA, USAID, and AAG, with the AAG also administering the program. SERVIR, an acronym meaning “to serve” in Spanish, is a joint venture between NASA and USAID. SERVIR works in partnership with leading regional organizations around the globe to help developing countries use information provided by Earth-observing satellites and geospatial technologies to better manage climate risks and sustainability of natural resources.

To learn more about the full My Community, Our Earth / SERVIR program, contact Project Director Dr. Patricia Solís at psolis [at] aag [dot] org. Or, visit https://www.aag.org/mycoe.servir. Read more detailed information on the NASA event.

    Share

AAG Book Awards Celebrate Works Written by Geographers

The AAG presented the following book awards during an awards luncheon at the 2014 AAG Annual Meeting in Tampa on April 12.

2013 John Brinckerhoff Jackson Prize

 This award encourages and rewards American geographers who write books about the United States which convey the insights of professional geography in language that is both interesting and attractive to lay readers.

Anne Kelly Knowles, Middlebury College
Mastering Iron: The Struggle to Modernize an American Industry, 1800-1868
Published by the University of Chicago Press, 2013

In collaboration with Chester Harvey who is the cartographer for this copiously illustrated volume, Anne Kelly Knowles has set a new standard for historical geography.  This noteworthy volume blends regional and local scale geography with rich archival sources to offer new insights into a neglected topic – the ante-bellum iron industry in the United States.  She examines this particular economic activity because it provided the foundation for the country’s later industrial might, and it also allowed for the exploration of technology transfer from the United Kingdom to the U.S. during the time the industry was expanding across the landscape.

It is a richly empirical work and draws on a range of sources from company records to national surveys.  Through these sources, she demonstrates the power of considering the industry at multiple scales – as part of the Atlantic World, the manufacturing core of the U.S., and company towns.  She creatively uses color maps to vibrantly illustrate the migration of the industry from the eastern seaboard, the spatial realities of resources and processing centers, the relationship of the industry to population centers, and the layout of iron-making communities.  The graphics add a perspective that few historians would be able to replicate in prose alone, making for a much more powerful and compelling argument. Throughout the work, she solidly documents her arguments with persuasive evidence.  Family and corporate papers shore up her case at the local scale. To make her argument for the overall growth of the industry, she turned to a national survey of iron making and the U.S. Census.  She deftly sustains her narrative at multiple scales.  Drawn from the archives are a splendid array of historical photographs, contemporary maps, and colorful artwork that enliven the presentation.  Knowles relies heavily on empirical evidence and avoids the tortured language of theoretically oriented treatises. Nonetheless, she clearly situates her work in the context of relevant theories and engages effectively with the likes of Latour and Harvey, as well as historians of technology.

The AAG Globe Book Award for Public Understanding of Geography

This award is given for a book written or co-authored by a geographer that conveys most powerfully the nature and importance of geography to the non-academic world.

Michael Dear, University of California, Berkeley
Why Walls Won’t Work: Repairing the US–Mexico Divide
Published by the Oxford University Press, 2013

Many of the best geographical stories take a feature on the land — either one that exists physically, or something placed there by human activity — and looks into backstory, evolution, and implications. It matters not at all if the feature is a theme park, an historic road, a botanical garden, a modest meetinghouse, a collection of skyscrapers: each is geographical in its quintessence. What Michael Dear gives us in his 2013 book, Why Walls Won’t Work: Repairing the US–Mexico Divide, is a particularly acute take on a vast human-imposed creation, the nearly 2,000-mile-long US-Mexico boundary.

Themes include cartography and border expeditions; discussions of law and order; comparisons of South and North; a chapter titled “Fortress USA;” and a concluding eponymous chapter, “Why Walls Won’t Work” that collectively spell out the long history of established uncertainty in the relationship of the United States and Mexico.

Perhaps the abiding question is not “why walls won’t work,” but when that will become obvious in a world of push-pull factors, international economic inequality, and migrant mobility. Text on a concluding page recaptures an energy many of us were reminded of in 1990 as the Berlin Wall was reduced to rubble: “The Wall separating Mexico and the US will come down. Walls always do. Partition is the crudest tool in the armory of geopolitics, an overt confession of failed diplomacy.”

Eminently worthy of the prestigious AAG Globe Book Award, Why Walls Won’t Work is a geographer-planner’s timely text on the dimensions of territory.

AAG Meridian Book Award for Outstanding Scholarly Work in Geography

This award is given for a book written by a geographer that makes an unusually important contribution to advancing the science and art of geography. 

Richard Schroeder, Rutgers University
Africa after Apartheid: South Africa, Race and Nation in Tanzania
Published by the Indiana University Press, 2012

Africa after Apartheid explores what has happened to the region of southern Africa in the wake of Apartheid. A timely, important and deeply geographic book, Schroeder beautifully ties together economics, human migration, race relations, cultural changes, and a bit of physical landscape in tracing how the end of Apartheid had massive consequences for neighboring countries, especially in terms of capital investment and its concomitant race relations. While Schroeder focuses on a vitally important region and story, it could also be mirrored in other postcolonial settings. Where do rulers go, what do they do, and how do they act after the demise of their regime? In addition to Africa After Apartheid’s major empirical and theoretical contributions, the book is extremely well-written and accessible to non-specialists. His book significantly enhances our understanding of southern African geography.

Stuart Elden, University of Warwick
The Birth of Territory
Published by the University of Chicago Press, 2013

The Birth of Territory is a landmark study of territory as an organizational principle to divide, order, and control land.  Despite territory’s foundational position in geography and politics, it has received relatively little critical attention in terms of its historical, geographical, and political production.  Stuart Elden provides a thorough genealogy of territory and its evolution in western political thought from ancient to early modern periods and substantially pries open a concept that is often taken for granted. He convincingly presents a case for territory as contingent, contested, and far from settled in terms of its political salience and uneven development, with sources ranged from historical, political, and literacy texts and practices. Written in an eloquent and engaging style, Elden’s work will surely provide a new baseline for geographers’ understanding of territory and become an important text for geography and associated disciplines in the investigation of space, power, land, development, and political order.

    Share

The Kissimmee: A Tale of Three Rivers

In the central part of peninsular Florida, in a hot and humid place with lousy cell phone reception, lies a river on its third lifetime.  The headwaters of this river, the Kissimmee, located near Orlando are filled with lakes formed in karst topography due to the presence of soluble limestone deposits near the surface. The upper basin drainage is comprised of river segments that connect lakes, like beads on a chain, and flows towards Lake Kissimmee, which is 141 km² (55 mi2) in area.  The lower Kissimmee drainage flows between Lakes Kissimmee and Okeechobee, which some call “The Big O”, derived from a Seminole word meaning “big water”.  Lake Okeechobee is shallow, averaging only 3m (9 ft) in depth, but covers 1,900 km2 (730 mi2), making it by area the largest freshwater lake in the state of Florida and the second largest freshwater lake contained entirely within the lower 48 states.  This story overviews the three lifetimes of the Lower Kissimmee River. The first is that of a river with an unusual natural hydrology of prolonged flooding; in the second lifetime, the river was channelized for flood control creating “the Big Ditch,” now transitioning to its third lifetime as one of the world’s largest river restoration projects.

Historically, the Lower Kissimmee River had an unusual hydrology with prolonged flooding, several months in duration annually, due to the low regional slopes, the flow or drainage between these two large lakes and the occurrence of backwater from Lake Okeechobee.  Many rivers overtop their banks for only a few days each year, some larger rivers may flood for a few months here and there, but the Kissimmee was flooding for a few months all years and in some years half the time or more.  During this first life, the river corridor was a haven for fish and wildlife with at least 39 species of fish and 38 species of water birds, which thrived off a floodplain with prolonged flooding and water-filled areas of various types and sizes, including many secondary channels, sloughs, ponds, lakes and prairies.  In the 1880s, there were some early efforts to modify the river by Hamilton Disston, a Pennsylvania industrialist and developer who had purchased of 16,000 km² (6200 mi2) of Florida land in 1881, one of the largest land purchases by a single person in world history (Godfrey and Catton, 2011).  The Kissimmee was part of his work, and he performed some dredging and made two artificial cutoffs, but ultimately had minimal effect on the hydrology.  Following the Okeechobee hurricane of 1928, the lowermost 10 km of the Kissimmee adjoining Lake Okeechobee were channelized, but the flooding was still mostly uncontrolled and allowed for a wet floodplain that supported diverse wildlife and aquatic biota.

Figure 1


Over time, as the area became developed, cattle ranchers moved into the floodplain.  Tropical cyclones came in cycles, and ranchers lost a lot of livestock during floods in the 1940s, in particular the flood of 1947. A report describing the damages featured a crying cow on the cover, prompting Congress to authorize in the following year the Central & Southern Florida Project for flood protection.  The Kissimmee River portion of the project was authorized in 1954, and its planning and design then took place for several years until construction began in 1962.  The project entailed creating a much straighter (166 to 90 km), deeper and larger capacity channel named C-38 across the middle of the floodplain, with the dredged material being deposited adjacent to the canal. Six water control structures (S-65 to S-65E) regulated inflow from the upper basin and divided the canal into reservoirs (Pools A-E), greatly reducing water level fluctuations (Figure 1).  For the most part, the original Kissimmee River channel meanders were left intact, cutting back and forth across the new C-38 or “`Big Ditch” representing the second lifetime of the river.  Water control structures and canals were built in the upper lakes region, which allowed for regulation of water flow within and between the lakes of the upper basin.   The cost was $40 million, and the project was an engineering success.  However, the alteration of the system’s hydrologic characteristics and the drainage of floodplain wetlands resulted in an environmental disaster with bird and wildlife populations plummeting over 90%.  The lack of flow in the historic channel remnants increased floating exotic plants, organic and fine sediment accumulation, biological oxygen demand and nutrients, and decreased dissolved oxygen levels and fisheries in both the river and the lake.  Stabilized water levels and reduced flow also eliminated river-floodplain interactions, spawning, and larval and juvenile refuge sites.

Although realization of this environment mistake was immediate, it took a few decades for the Kissimmee River Restoration Project to be authorized by Congress in the 1992 Water Resources Development Act.  In its third life, the central portion of the Lower Kissimmee River is being restored by land acquisition, backfilling C-38 with its dredge spoil, rerouting flow back into the former historical channel, and removing two of the six structures (Figure 2).  The project is being undertaken jointly by the South Florida Water Management District (SFWMD) and the US Army Corps of Engineers (USACE).  Some call it the world’s largest river restoration project, with restoration defined by the National Research Council  (1992) meaning the manipulation of the physical, chemical, or biological characteristics aiming to return natural/historic functions to a former or degraded aquatic resource.  The channel reconfiguration of the Kissimmee River is a currently $980 million project, very large in magnitude for a river restoration project but small in comparison to the Everglades restoration, which will span 30 years and cost $13.5 billion at 2009 price levels (Secretary of the Army and the Secretary of the Interior 2011).  The Kissimmee restoration is being done in phases, with the first beginning in 1999 and now the latter phase is underway with a current target completion date of 2015 (South Florida Water Management District, 2012), to be monitored for 5 years upon the end of construction to ensure restoration success.  Floodplain inundation has returned, as have sand bars and several species of wading birds that disappeared.  However,  given upstream and downstream development and demands for water, plus the remaining human footprint, the restored river will be much improved ecologically from its channelized condition but remains a hybrid of its natural and altered form and function.

kissimmee_fig_2 Figure 2

Thus the Kissimmee River’s early past is unusual in the duration and magnitude of flooding, which then resulted in channelization and regulation of the river with structures to control these floods, and currently there is large river restoration undertaking for part of the system.   Visiting the restored areas in the field is difficult, although bridges traverse some sections of the channelized areas.  However, a virtual tour of the river on Google Earth© is recommended to compare differences in the restored system from the channelized system upstream and downstream.  Also, there is a short video on a website that gives a brief overview of the area.  Although there is no river like the Kissimmee, many other rivers in Florida also have interesting stories which you can learn more by attending one of the field trips at the annual meeting in Tampa.

—Joann Mossa
University of Florida

DOI: 10.14433/2014.0007

References

Godfrey, M.C. and Catton, T (2011) River of Interests: Water Management in South Florida and the Everglades, 1948-2010. Historical Research Associates Inc., US Government Printing Office, Washington, DC

National Research Council (1992) Restoration of Aquatic Ecosystems: Science, Technology, and Public Policy. National Academies Press, Washington, DC. DOI: 10.1002/iroh.19930780304.

Secretary of the Army and the Secretary of the Interior (2011) Comprehensive Everglades Restoration Plan 2010 Report to Congress.

South Florida Water Management District. 2012. https://www.sfwmd.gov/portal/page/portal/xrepository/sfwmd_repository_pdf/jtf_krr_progress.pdf

    Share

The Geography of Environmental Destruction in North America

The following test is recommended for all those who plan on attending the Annual Meetings of the Association of American Geographers next April, 2014, in Tampa, Florida.  The test is voluntary and you are under no obligation to take it; you may stop at any time, or answer any combination of questions.  Results will be kept confidential to the maximum extent of the law, and will not affect your AAG membership or ability to participate in the meetings.  This test is meant as a learning guide for what you are about to experience, the tipping point from an ecological past to an artificial future.  Disclosure:  One all-purpose answer sufficient; fill in blank at bottom.

1)    What state experienced a rate of natural areas conversion to agriculture and residential land use that exceeded the rate of tropical deforestation during the 1980s?   In what state did the U.S. Army Corps of Engineers do so much environmental damage that hundreds of millions of dollars are being spent to undo what they did, and originally justified with cost-benefit analyses demonstrating that the destruction of nature would enhance the value of nature, in part by making lands accessible to hunters, who derive recreational benefits from shooting waterfowl (hint: same state)?

2)    What state possesses 7800 lakes, more than any other south of the glaciated terrains of Wisconsin and Minnesota, The Land of 10,000 Lakes.  What state has 425 species of birds, 3500 species of plants, and 65 species of snakes?  What state possesses the largest concentration of first magnitude artesian springs in the world, as well as the world’s largest spring, with water as clear as air that aborigines and colonials thought possessed curative powers and may have inspired explorations of the North American continent by Spanish conquistadors?  In what state is this unique resource being destroyed by the excessive pumping of aquifers, by nitrogen fertilization, and by changing social preferences that discount the value of natural areas in favor of controlled and artificial environments such as found in theme parks (hint: Think Disney World)?

3)    In what state could settlers launch canoes in the south and paddle through interconnected swamps, marshes, and lakes, all the way to its northern border, some 350 miles distant, traversing five degrees of latitude and a wildly diverse landscape, with stands of tropical mahogany (Swietenia Magahoni) and forests of temperate hardwood emerging from extensive wetlands that accounted for ~53 percent of the state’s original territorial expanse, as granted under the 1850 Submerged and Overflowed Lands act of the Federal Government (hint: Think Everglades National Park)?

4)    In what state did an Amerindian population resist Presidents Jackson’s Indian Removal Act, which deported indigenous peoples along the so-called trail of tears to lands west of the Mississippi River, an Amerindian population that engaged the US Army in three successive wars spanning nearly half a century?  In what state did Amerindians kill the first governor of Puerto Rico, who’d sailed in search of riches but found his own mortality instead?  What state possessed open range and an active settlement frontier that was closed only several decades into the 20th century?  In what state did a murderous gunslinger and a regional development visionary merge in the mind of a single man, immortalized by the historical fiction of Peter Matthiessen for his death at the hands of vigilantes, fearful he would kill them as he’d murdered his African-American cane-cutters rather than pay them wages, in his obsession to create an agricultural economy in a land of swamps and marshes (hint: same state)?

5)    What state presents a microcosm of a global society given its cultural diversity?  What state presents a microcosm of a global ecocide given its exotic species invasions by both land and sea (hint: think rivers choked by Amazonian water hyacinth and Eurasian milfoil, reefs destroyed by the Indo-Pacific lionfish, wetlands desertified by Australian Melaleuca trees, etc.)?

6)    In what state has the august body of the conference coordinating committee of the Association of American Geographers selected a city for their 2014 national meetings that puts conference attendees within 125 miles of several exquisite museums of the recent ecological past, including (a) a subtropical hardwood hammock with old growth cypress (Taxodium distichum) and live oak (Quercus Virginiana); (b) an artesian spring-head whose crystalline waters source a river to the Gulf of Mexico and provide habitat for the aquatically itinerant manatee; (c) a pristine barrier island whose native sabal palm trees (Sabal palmetto) are holding their own against invasive Brazil peppers and Casuarina spp.; and (d) a 24 mile stretch of undeveloped Atlantic coastline with pre-Colombian atmospherics (hint: same state)?  [Note that in less than an hour (~60 miles), attendees may also witness the ecological future, namely (e) the destruction of the natural world and its replacement by artificial environments, an experience partly mitigated by (f) a smoking-hot night-life with great Cuban food in the conference town.]

Answer: ________________________________ [see g below for final hint]

a)     Highlands Hammock State Park
b)     Homosassa Springs Wildlife State Park
c)     Caladesi Island State Park
d)     Canaveral National Seashore
e)     Disney World and its Splinterlands
f)     Tampa, meeting location
g)     THE SUNSHINE STATE

Robert Walker

DOI: 10.14433/2014.0003

    Share

Water, Growth and Tampa Bay

Florida is practically synonymous with water and at first blush it seems inconceivable that the Sunshine State could have water problems typical of drier western states. After all, Florida averages 54 inches of rainfall each year and despite more than a century of drainage, it still has more acres of wetlands than any state except Alaska. It also has nearly 8,000 lakes at least one acre in extent, more than 1,700 streams of all lengths and widths, and it is underlain by the Floridan aquifer, one of the most productive groundwater formations in the world. Given this, it probably comes as no surprise that peninsular Florida has more than 700 springs—the largest concentration of freshwater springs in the world. Indeed, for much of Florida’s history, people have struggled with too much water.

By the 1970s, however, rapid population growth in the Tampa Bay region and elsewhere stressed the state’s water resources. In response, the Florida legislature created five water management districts (WMDs), encompassing the entire state (figure 1). Water management district boundaries are based on surface water hydrologic divides, which is better than political boundaries, but less helpful in a state dominated by groundwater use. Florida’s water management districts are quasi state agencies, under the supervision of the Florida Department of Environmental Protection—and the state constitution demands that they manage water resources sustainably while accommodating all current and future uses (at best, a difficult balancing act).

Figure 1

As is true for the rest of Florida, growth and development in the greater Tampa Bay region has long depended on water control. For nearly a century, the City of Tampa has tapped the Hillsborough River as a water supply. As late as the 1960s, flooding along portions of the 54-mile Hillsborough River remained the most critical water issue in Tampa. Meanwhile, continued population growth throughout the region, especially on the western side of Tampa Bay (in Pinellas County, featuring St. Petersburg and Clearwater; Figure 2), relied on access to inexpensive but high quality groundwater. Saltwater intrusion into Pinellas County well fields has been a problem since the 1920s, so Pinellas authorities ultimately bought land for well fields in rural but inland portions of neighboring Pasco and Hillsborough counties. Yet by the 1980s, many people living in these rural areas began to see the negative impacts of excessive groundwater pumping. Specifically, wetlands and lakes began drying up, much to the chagrin of property owners who built docks and boathouses that eventually extended to dry land.

While some officials blamed drought for disappearing surface water, the Southwest Florida Water Management District (often called Swiftmud) eventually demanded that Pinellas utilities reduce groundwater pumping. Swiftmud’s stance threatened the region’s growth coalition: politicians, realtors, home builders and other business leaders who believed that continued access to inexpensive groundwater remained vital to sustain continued population growth and economic development. After more than a decade of costly political and legal wrangling between Swiftmud and Pinellas County leaders (known locally as the Tampa Bay Water Wars), a settlement finally emerged in 1997. Swiftmud agreed to help a new regional water wholesaler (Tampa Bay Water) build new and expensive water infrastructure that would eventually reduce the pressure on groundwater resources while accommodating future growth and development.

Figure 2

As a result, Tampa Bay is now home to the largest desalination plant in the western hemisphere (even if water managers in California may soon claim this distinction). Plagued by serious technical problems and cost overruns, the $158 million plant finally achieved peak production of 25 million gallons per day (mgd) in late 2007. To put this in perspective, the three Tampa Bay area counties of Hillsborough, Pinellas and Pasco used 432 mgd of fresh water in 2005. Despite the advantages of flat topography (which keeps distribution costs low compared to regions with more hilly topography), drawing water from the Tampa Bay estuary (which is somewhat less salty than sea water, so it reduces treatment costs), and a location adjacent to a power plant that discharges higher temperature water used for cooling (further reducing treatment costs)—despite these advantages, the desalination plant often operates well below capacity because it produces water that costs more than other sources.

That is not all. Swiftmud also agreed to subsidize the construction of the 15 billion gallon C.W. Bill Young Regional Reservoir that would store excess surface water from local streams during the summer rainy season for use during the region’s relatively dry winter and spring. This $146 million facility developed cracks soon after opening in 2005, and, after spending several million dollars trying to make repairs and suing the original contractor, not only did Tampa Bay Water lose the lawsuit but its customers now have to pay $129 million to rebuild the reservoir. Finally, Tampa Bay Water also spent $144 million on a surface water treatment facility, which makes potable water from a variety of surface sources including the broken reservoir, the desalination plant, and local streams. Like the other projects, this treatment plant experienced problems at first, but is now functioning properly.

On top of all of this, several Tampa Bay communities continue to invest millions of dollars laying pipes and building pump stations to distribute treated wastewater from sewage treatment plants (often called reclaimed water) for use in irrigating golf courses, parks, and yards, as well as for industrial and limited agricultural use. Making use of treated wastewater is not only drought resistant, it reduces the use of drinking water for growing grass. In 1977, Tampa’s neighbor, St. Petersburg, initiated the first large urban water reuse system in the United States. Florida (along with California) leads the nation in its use of reclaimed water; data from a May 2013 Florida Department of Environmental Protection report show that the Sunshine State now reuses about 45% of treated wastewater discharged from sewage treatment plants. Similarly, Swiftmud contends that 44% of all the treated wastewater leaving sewage treatment plants in the district is now reused.

For Tampa Bay and most of the rest of Florida, authorities are already making maximum use of inexpensive groundwater, and they have begun to tap more expensive water in order to continue fanning the flames of population growth and development. Few would argue with calls to reduce water use by using water more efficiently. Yet many people are annoyed that they have to reduce their water use in order to provide water to support continued development. Worse, major water utilities investing in expensive infrastructure depend on a certain level of water sales to pay for such infrastructure; when people buy less water (conserve!), utilities often have to charge more (per unit) for what they sell. In the U.S., costs associated with public water provision are often distributed evenly among a population, with the occasional exception of instituting progressively higher rates for larger amounts of consumption/use. Certainly those who benefit the most from constant population and economic growth favor this approach. What might make more sense, however, is assigning a larger percentage of the cost of developing more expensive sources of water to those who create that need in the first place. Regardless, future water use will almost certainly be more expensive; the remaining questions are how much will it cost and who will foot the bill?

Christopher Meindl
University of South Florida – St. Petersburg

Maps by Andy Hayslip
University of South Florida – St. Petersburg

DOI: 10.14433/2014.0004


Further Reading

Cynthia Barnett. 2007. Mirage: Florida and the Vanishing Water of the Eastern U.S. Ann Arbor: University of Michigan Press.

Nelson M. Blake, Christopher F. Meindl, Steven Noll, and David Tegeder. 2010 (2nd edition). Land Into Water, Water Into Land: A History of Water Management in Florida. Gainesville: University Press of Florida.

Elizabeth D. Purdum, Peter A. Kraft, Edward A. Fernald, and James R. Anderson (eds.). 1998. Water Resources Atlas of Florida. Tallahassee:  Florida State University, Institute of Science and Public Affairs.

John T. Scholz and Bruce Stiftel. 2005. Adaptive Governance and Water Conflict: New Institutions for Collaborative Planning. London: Routledge.

Tom Swihart. 2011. Florida’s Water: A Fragile Resource in a Vulnerable State. Washington, DC: Resources for the Future Press.

    Share

New Books: February 2014

Every month the AAG compiles a list of newly-published books in geography and related areas. Some are selected for review in the AAG Review of Books.

Publishers are welcome to send new volumes to the Editor-in-Chief (Kent Mathewson, Editor-in-Chief, AAG Review of BooksDepartment of Geography and Anthropology, Louisiana State University, Baton Rouge, LA 70803).

Anyone interested in reviewing these or other titles should also contact the Editor-in-Chief.

February 2014

    Share

Efforts of AAG and Others Defeat Coburn Amendment

The omnibus appropriations bill for Fiscal Year 2014 that was signed into law by President Obama on January 17 was widely hailed as a rare departure from the recent cycle of federal budget battles. The legislation received significant bipartisan support in both houses of Congress and headed off any chance of a government shutdown until at least October.

Significantly for geographers and the wider social science community, the bill does not contain the so-called “Coburn Amendment,” which passed in March 2013 and prevented the National Science Foundation (NSF) from funding political science studies other than research “certified as promoting national security or the economic interests of the United States.” Enactment of the Coburn Amendment prompted the AAG to work with our friends at the American Political Science Association (APSA) and many others in the science and higher education communities to promote the importance of political and social science research, and urge Congress to undo the restrictions.

Over the last several months, we at the AAG have worked closely with the APSA (see letter: https://www.aag.org/galleries/govt-relations/Thank_you_letter_to_AAG.pdf), the American Association for the Advancement of Science (AAAS), the Consortium of Social Science Associations (COSSA), the Coalition for National Science Funding (CNSF), and many other key organizations in an effort to undo the damage caused by the Coburn Amendment and to prevent the possibility of wider-reaching restrictions blocking funding for the social sciences broadly. As part of these efforts, the AAG has:

  • Adopted an AAG Council resolution opposing the Coburn Amendment
  • Educated members and others through an interactive page on the AAG website (https://www.aag.org/cs/social_science_funding) about threats to federal research funding
  • Sent multiple calls to action to all AAG members detailing concerns related to sequestration and issues such as the Coburn Amendment
  • Coordinated closely with the APSA agenda, per their request, in our response to the Coburn Amendment
  • Signed onto numerous letters, including a AAAS-organized letter urging the House Science Committee to protect the integrity of the merit-review process for all disciplines, including the social and behavioral sciences; and a CNSF-organized letter urging the House Science Committee to fully fund programs that support social science research

While we are delighted that the recently-passed omnibus spending bill does not contain the Coburn Amendment or any related restrictions on the social and behavioral sciences, we recognize that we must remain vigilant to protect this funding in the coming months. As part of these efforts, we urge AAG members to contact your Senators and Representative to express your views about federal funding for the social sciences.

The omnibus bill also marked a win for National Science Foundation (NSF) funding overall. The Foundation will receive $7.17 billion for FY 2014, which represents a 4.2 percent increase when accounting for the sequestration cuts that were applied last year.

The links below provide information about contacting members of Congress through the phone or internet. AAG members may also wish to use social media, such as Twitter or Facebook, to share their perspectives with elected officials, friends, colleagues, and the wider community.

Contact information for all U.S. Senators can be found at: https://www.senate.gov/general/contact_information/senators_cfm.cfm.

You can locate your member of the House of Representatives by going to: https://www.house.gov/representatives/find/.

If you have any questions, please do not hesitate to contact John Wertman, the AAG’s Senior Program Manager for Government Relations, at jwertman [at] aag [dot] org, or Doug Richardson, AAG Executive Director, at drichardson [at] aag [dot] org.

    Share

New Books: December 2013

Every month the AAG compiles a list of newly-published books in geography and related areas. Some are selected for review in the AAG Review of Books.

Publishers are welcome to send new volumes to the Editor-in-Chief (Kent Mathewson, Editor-in-Chief, AAG Review of BooksDepartment of Geography and Anthropology, Louisiana State University, Baton Rouge, LA 70803).

Anyone interested in reviewing these or other titles should also contact the Editor-in-Chief.

December, 2013

    Share

I’ll Follow the Sun … to Tampa

By April, you are likely to be thinking that it’s been a long cold lonely winter. If you’ve booked your ticket to ride to our 2014 AAG annual meeting in Tampa, then a good day sunshine may very well be on the horizon. Florida’s peninsular shape, concave and convex coastal segments and location between the Gulf of Mexico and the North Atlantic Ocean all play an essential part in the development of the state’s weather (Stowers and Tabb 1987). Spanning latitudes 25-30° N, most of the state experiences humid subtropical conditions according to the climate classification developed by Köppen. When the rain comes, they run and hide their heads from an average of 46.3 inches in Tampa (Hillsborough County) and 50.8 inches in St. Petersburg (Pinellas County) each year (NWS Data). For two months of the year, the average high temperature in Tampa is above 90°F with relative humidity above 50 percent, yet Sunshine State weather in April tends to feel fine with an average high at just 81° F.

However, tangerine trees and marmalade skies can give way to damaging winds and heavy rains, leaving many with a need to fix the holes where the rain gets in. Florida is not a stranger to thunderstorms. In fact, lightning occurs so frequently within Florida that the state is considered the lightning capital of the United States with over fifty strikes per square mile per year (Mogil and Seaman 2008). Cloud-to-ground lightning often streams helter skelter across the landscape as the state’s highest flash densities occur in West-Central Florida around Tampa Bay. This is due to the collision of sea breeze boundaries in this area of the state, especially during June-August. Spectacular offshore lightning displays at night can be triggered by land breezes. So come to Florida and join the local hockey fans who enjoy a fantastic “Lightning” display.

Tornadoes have occurred in every state. However, some may be surprised to learn that Florida was ranked third in average annual tornadoes per state 1991-2010 according to data from the National Climatic Data Center (NCDC). Florida had an average of 66 tornadoes reported annually during that period, including 105 in 2004 alone. April 2014 marks 49 years since an F4 tornado moved across Pinellas and Hillsborough Counties and continued across the peninsula causing upwards of 3300 injuries with 11 deaths. It is the only F4 tornado occurring in Florida since 1950 according to data from the Storm Prediction Center. Fortunately, no other April tornadoes have caused the wind to be high within Hillsborough County where our meeting will be held. Water spouts are also a common occurrence along Florida’s coastline. A 15-year study by Golden (1977) found that the Florida Keys experienced the greatest frequency of water spouts from Texas to Maine. But when you talk about destruction, Tampa Bay had the highest number of damaging cases.

Figure 1. Tracks of tropical cyclones making landfall over Florida 1851-2011.

The severe weather phenomenon most often associated with Florida is the hurricane. While Tampa has not experienced a landfall in many years, the state of Florida has not been so fortunate. Florida experiences twice as many landfalling hurricanes as the next prevalent state, Texas. After using a GIS to plot the tracks of all tropical cyclone during 1851-2011 (Figure 1), it can be seen that 269 have crossed the boundary of Florida, yielding an average of 1.67 landfalls per year and many a wild and windy night. Fortunately for AAG attendees, no Florida landfalls have occurred during April. Unlike some other national events held in Tampa e.g. the 2012 RNC, the AAG invites its members to Tampa before hurricane season starts!

When considering the impacts of these various weather phenomena, one must also consider the number of people who have come together to live in the Tampa Bay area. Population growth from 1950 – 2010 was 390% for Hillsborough County and 475% for Pinellas County. Neighboring Polk and Pasco Counties experienced growth of 385% and 2165%, respectively under their blue suburban skies. The implications of this growth are staggering in terms of the number of people left to make ends meet and millions of dollars involved if disastrous weather should strike the Tampa Bay area. Given the shallow bathymetry of the bay, the infrastructure built along and near its shores, and the high population density in the area, the costs of Hurricanes Andrew, Katrina, or Sandy could easily be surpassed if a similar storm hit Tampa.

Yet before the arrival of hot weather and hurricanes, April is a great month to be outdoors and follow the sun in Tampa. According to the NCDC, the average high and low temperatures for the week of the AAG conference approximate 80° and 61° F, making for a fab forecast. Unfortunately for those who like to watch endless rain pouring into a paper cup, April is the second driest month receiving only 2.03 inches of rainfall on average. If you do wear a raincoat, you may be standing solo in the sun as April is tied with May as the sunniest month of the year, with 75% of possible sunshine occurring. Sun, sun, sun, here it comes! With sunshine at its highest, temperatures at their most pleasant, and severe weather occurrences at their lowest, the weather is sure to please please you during the 2014 AAG annual meeting in Tampa. We hope you will enjoy the show.

Dr. Jennifer Collins
University of South Florida

Dr. Corene Matyas
University of Florida

References

Golden, J. H., 1977, An assessment of waterspout frequencies along the U. S. East and Gulf Coasts. J. Appl. Meteor.16, 231-236. DOI:10.1175/1520-0450(1977)016<0231:AAOWFA>2.0.CO;2
Mogil, H.M., and K.L. Seaman, 2008, Florida’s climate and weather. Weatherwise, 61, 14-19. https://www.weatherwise.org/Archives/Back%20Issues/November-December%202008/abstract-mogil-seaman.html
Stowers, D.M., and N.D. Tabb 1987, An investigation of the variances from the traditional summer precipitation in the west-central Florida region. Florida Scientist50, 177-183.
    Share