Exploring New Orleans and Beyond Using Web Mapping Tools, Maps, and Data
The evolution of geographic information system (GIS) technology to the web presents an excellent opportunity for the geography community to foster spatial thinking among colleagues, students, and administrators. The use of web maps, spatial data, and analysis tools to examine local to global issues has never been so powerful and easy to embrace. It also provides a means for the community to promote geography as an essential twenty-first-century subject to the general public.
With the upcoming 2018 AAG Annual Meeting in New Orleans in April, these web maps and analysis tools can be used by anyone to thoroughly explore the city in order to enhance the time spent there and in the surrounding area.
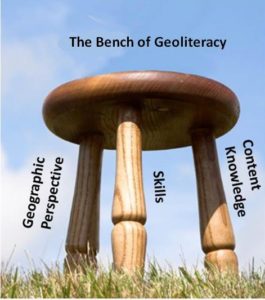
The following examples illustrate the use of geographic data and tools in an inquiry-driven environment. These maps cultivate the three legs holding a bench that I believe constitutes geographic literacy: content knowledge, skills, and the geographic perspective.
Teaching with these tools can foster students’ knowledge of core content, including concepts (scale, diffusion, patterns, relationships, systems), regions, and themes (geomorphology, watersheds, demographics, ecoregions). Skills include the use of maps, analyzing data, assessing data quality, charting, collecting and analyzing field data, symbolizing maps, and communicating geographic content. Through use of these tools, the geographic perspective—in which geographers see the world working through a series of interwoven, changing spatial relationships operating at a wide variety of scales—can be promoted.
These tools can also promote the idea that big data exists at our fingertips, but it is of varying quality. Mapped data is distorted due to its map projection and may have gaps in attributes or resolution and scale. Inquiring about the data’s origins, date, scale, and other characteristics and examining metadata are key to data’s effective use. Discussions about copyright, location privacy, data aggregation, interpretation, dissemination, and communication can be interwoven with the following maps and activities. Through each, students can see that every issue in our world and communities has a geographic component.
To start, let us focus on a few easy-to-use yet powerful tools, modeling how to use these resources in instruction. As an example, we will explore New Orleans and the surrounding region, but these tools can be used to study other regions as well.
Examining Change over Time Using Photographs and Satellite Imagery
The Esri ChangeMatters Viewer
Historical and current satellite images can be compared via the Esri ChangeMatters viewer. Its Landsat images are recorded in infrared wavelengths, providing a springboard for discussion about the electromagnetic spectrum and what different wavelengths reveal. Because the US Geological Survey (USGS) and the National Aeronautics and Space Administration (NASA) have been operating the Landsat satellites since 1972, over 45 years of earth changes are viewable with this single tool. These images can be interacted with in a three-panel view with time period one on the left, time period two in the center, and the change detection image on the right.

What has changed, and why has it changed? What will this area look like in 10 years? Is it changing more quickly or more slowly than other parts of the world? Why? How does the land use here compare to elsewhere in the world? What influence does population, climate, or coastlines have on land use? Can you estimate the population in the area shown? What type of dwellings exist, and how do these dwellings compare in size and density to other regions?
As an example, the intersection of such issues as irrigation, politics, climate, and internal drainage can be discussed by examining the shrinking Aral Sea in Central Asia over the past 40 years. The physical characteristics of the eruption of Mount St. Helens, the regrowth of some surrounding vegetation, and the volcano’s proximity to Portland and other regional volcanoes can be examined with the same tool. The urban growth of Las Vegas or São Paulo, the construction of the Three Gorges Dam and other dams, the expansion of center-pivot irrigation in the United States and Saudi Arabia, agricultural and mining expansion and reclamation, and changes in coastlines and glaciers are just a few of the themes that can also be examined using the ChangeMatters viewer.
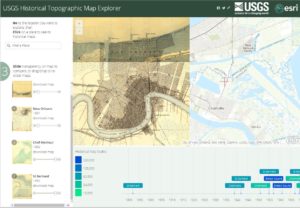
The USGS Esri Historical Topographic Map Explorer
Physical and human-induced land-use and land-cover changes can be examined at a variety of scales using tens of thousands of USGS maps stretching back 100 years with the USGS Esri Historical Topographic Map Explorer. Enter a US-based location, click on the map, and choose from the historical maps covering that area, comparing them to the present-day topographic basemap. Each map’s transparency can be adjusted, allowing changes to be investigated. In New Orleans, the construction of levees, the Lake Pontchartrain Causeway, and draining of wetlands can be seen, along with below-sea-level contour lines that allow the physical setting of the city to be studied.
Supplementing the topographic map viewer with historical ground photographs can be instructive. Ground photographs taken in the same location during two different time periods can be used to analyze changes in land use, land cover, transportation, styles of clothing, the things that society values, and much more. Sources and maps include SepiaTown, WhatWasThere, and Historypin. Some historical street images are embedded in Google Street View scenes via a slider.
Urban Observatory
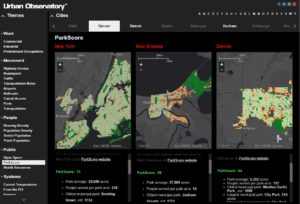
The Urban Observatory is a web-mapping application that allows 100 cities to be examined on dozens of variables. Created by Richard Saul Wurman, RadicalMedia, and Esri, the Urban Observatory provides a synchronized set of up to three maps, all showing the same theme and at the same scale. With this tool, you can analyze senior population, land use, current traffic, current weather, parks, and more. Up to three city maps can be viewed at once, and the maps are synchronized, making comparisons easy.
Demographic Analysis of New Orleans and Beyond
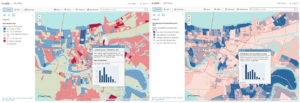
ArcGIS Online is a web-based mapping platform from Esri containing analytical tools, maps, data services, and databases, which are behind most of the mapping tools described in this article. Start with ArcGIS Online > Map > Modify Map, then search for and add data on median age and median income. In the resultant interactive web map, shown below, examine the spatial pattern at the city level, such as New Orleans, or at a regional or state level—with no login required. The transparency of any map can be adjusted; the basemap can be changed from the topographic map pictured to a satellite image, OpenStreetMap, or others. Layers such as hydrography, ecoregions, or land cover can also be added. The classification method, variable, number of classes, and symbology can all be changed to help students understand the relationships among various datasets. What patterns are evident, and why do they exist? How do the New Orleans patterns compare to those of other cities? How do the patterns change as the level of geography changes between block group, census tract, county, and state?
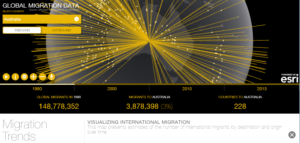
Migration touches the themes of physical geography (such as climate and landforms), cultural geography (political systems, political instability, boundaries, demographic trends), sociology (perception, push-pull factors), and change. Migration causes deep and long-lasting changes in culture, language, urban forms, food, land use, social policy, and politics. Migration is a global issue that affects our everyday lives. It is also a personal issue, because we all have a migration story to tell about our own ancestors and families. Part of the Esri Cool Maps gallery, the Migration Trends map is an interactive 2D and 3D web mapping application running in a browser.International Migration
Using data from the United Nations (UN) Department of Economic and Social Affairs, Migration Trends displays out-migration and in-migration data for every country from the 1990s, 2000s, 2010, and 2013. Line thicknesses indicate the number of migrants, and the line endpoints indicate the countries sending people out or receiving people. The raw number and percentage of out- and in-migration for each country are indicated. After viewing the animation, you can select individual countries and time periods. Compelling cartography and the ability to switch between 2D and 3D make this a useful teaching and research tool.
Is climate-induced sea level rise the reason why a high percentage of Reunion Island’s population is moving to the United States? Why so much flow between Russia and the UK? Why does Australia have a high percentage of migrants, and how has in-migration to Australia changed recently? See my video for more questions to pose using this map. Explore the other maps in the Esri Cool Maps gallery; they change periodically, so check back often.
Combining Fieldwork with Web Mapping
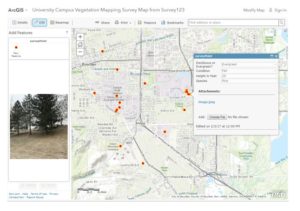
Survey123 for ArcGIS can be used on a mobile device to collect data quickly and easily in the field via a form that can be created using a web browser or an Excel spreadsheet. Students can collect information on tree height and species, water quality, pedestrian or vehicle counts, weather, graffiti, or anything else in the field. The results are immediately captured and displayed on interactive web maps, which can be symbolized, classified, and spatially analyzed. The maps can be crowdsourced so the public can add to the content.
Using and Creating Story Maps
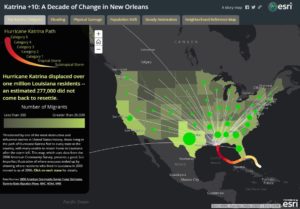
People have told stories through maps for thousands of years, and the Esri Story Maps web mapping applications allow multimedia to be easily incorporated into mapping. A gallery of story maps includes New Orleans topics ranging from Hurricane Katrina, gauging US population change, sea level rise and storm surge effects on energy assets, and Alan Lomax’s video archive of the Deep South. Students can create their own story maps to present their own research through interactive maps, text, video, audio, and photographs. Story maps can be shared online and used on any device. Story maps can serve as assessment pieces in student portfolios; provide an alternative to PowerPoint or Prezi for students’ oral presentations; and be embedded in web pages, Sway presentations, or other types of media.
Synthesis
Students who use web mapping in geography develop critical thinking skills and understand how to use and evaluate data. This is particularly important with geographic data due to its increasing volume and diversity and its often sensitive and politically charged nature. Students who are well-grounded in the spatial perspective through web mapping have the ability to use data at a variety of scales and contexts, think systematically and holistically, and use quantitative and qualitative approaches to solve problems and become better decision-makers. Students can use these tools to understand that the earth is changing and begin to think analytically about why it is changing. After using these web maps, students ask and grapple with value-based questions. Should the earth be changing in these ways? Is there anything I can and should do about it?
Joseph J. Kerski, PhD, Instructor, University of Denver, and Education Manager, Esri
Resources
The Esri Education Community blog focuses on geotechnologies in education: tools, best practices, maps, and more.
The Spatial Reserves blog and the book The GIS Guide to Public Domain Data, offer essays and activities on data sources, data quality, crowdsourcing, location privacy, and related topics.
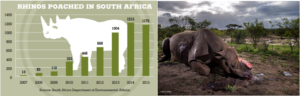
 The coastline formed by the Mississippi River is changing continually as part of the never-ending interplay between the forces and processes reshaping and realigning coastal contours and bathymetry. Over millennia, this formative process created Louisiana’s expansive wetlands that once encompassed 7.3 million acres (11,500 square miles) – about the size of Connecticut and Delaware combined – and accounted for at least 40 percent of the nation’s marsh/swamp ecosystems. This natural land-building process, however, has been disrupted by human activities in recent decades—with catastrophic results. Deprived of essential sediments, Louisiana’s coastal wetlands are subsiding and eroding at an alarming pace that casts into doubt humanity’s ability to inhabit and exploit one of the planet’s most economically productive regions.


 Tim Beach, Centennial Professor of Geography and Environment at UT Austin, presented an invited lecture on “Societal Collapses from the Maya to Mesopotamia and Beyond” at the Vatican in a workshop on
 The 2016 U.S. Elections: Implications for Geography and Beyond
 This special theme will feature 50 sessions with more than 250 presentations at the intersection of human rights and geography and will build on the AAG’s decade-long initiatives in this area. Speakers from leading international human rights organizations, academia, government, and NGOs will address human rights challenges around the world.
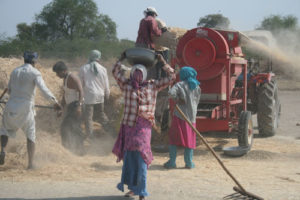 Geographies of Bread and Water
 The AAG is planning several activities to foster increased participation in the March for Science by AAG members and to provide resources and assistance for geographers who are planning to be in Washington on April 22:
 On Wednesday, April 5, the AAG Council will hold a town hall meeting for members to learn more about the association and its activities. This meeting gives an opportunity to ask questions and to provide input. The meeting is from 12-1 p.m., in the Commonwealth Room, Level 3, at the Sheraton.
 Get the most from your AAG 2017 Boston experience with the mobile app. Enjoy an interactive experience on your Apple, Android, BlackBerry and other mobile devices during the annual meeting. If you’re a laptop user or have a Windows phone, there’s also a Web version for your devices.
 Join us in celebrating the official launch of the International Encyclopedia of Geography: People, the Earth, Environment, and Technologies during an AAG International Reception in Boston! This
 The AAG Wilbanks Award for Transformational Research in Geography
 The National Center for Research in Geography Education (NCRGE) invites proposals to develop new collaborative and interdisciplinary research networks addressing major questions and challenges in geography education. Through this program, NCRGE aspires to strengthen geography education research processes and promote the growth of sustainable, and potentially transformative, lines of research.
 The AAG is pleased to announce that Volume 69, Issue 2 (May 2017) of The Professional Geographer is now available. The focus of The Professional Geographer is on short articles in academic or applied geography, emphasizing empirical studies and methodologies. These features may range in content and approach from rigorously analytic to broadly philosophical or prescriptive. The journal provides a forum for new ideas and alternative viewpoints. Each issue, the Editor chooses one article to make freely available. In this issue you can read The Price of Journals in Geography by Oliver T. Coomes, Tim R. Moore, and Sébastien Breau for free for the next three months.
 The AAG is pleased to announce that Volume 36, Issue 1 (April 2017) of the African Geographical Review is now available. The African Geographical Review is the journal of the Africa Specialty Group of the American Association of Geographers. It provides a medium for the publication of geographical material relating to Africa, seeks to enhance the standing of African regional geography, and to promote a better representation of African scholarship. Articles cover all sub-fields of geography, and can be theoretical, empirical or applied in nature.
 This month geographers from around the country and the world will gather in Boston for the AAG Annual Meeting. This should be a time of celebration for geographers. It is an occasion when we get together for exciting exchanges of ideas, reminisces with old friends and the chance to make new ones. In looking at the recent trajectory of our discipline and the AAG there is much to celebrate. However, it would be naïve to think that we do not also face some challenges. Some of these challenges are external, but some arise internally from the pressures created by the rapid growth and intellectual expansion of our discipline. Let’s take a look at all of this, and then consider some ideas on how at Boston we can derive maximum benefit and mitigate the challenges at hand.
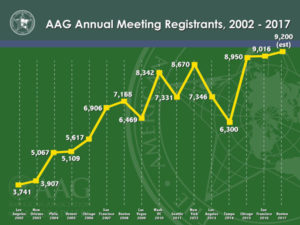 The AAG expects to host well over 9,000 registrants at the Boston meeting. This will be a record for the Association. The registrants come from countries around the world, including many from developing regions to whom the AAG offers special membership assistance. The size of the Boston meeting is not a singular fluke and should be viewed in the context of the remarkable growth of our annual meetings over the 21st century. Just 15 years ago our annual meetings had less than 4,000 attendees. Since that time there has been a strong, albeit sometimes noisy, increase in attendance.
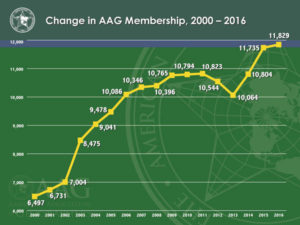 The growth in AAG membership and meeting attendance has occurred hand-in-hand with an increase in what the Association and meetings offer in terms of scholarly and intellectual exchanges and stimulation. At present there are almost 70 AAG Specialty and Affinity Groups – with more being proposed as new areas of geographical scholarship arise. Today these groups range in interest from A (Africa) to W (Water Resources). The astounding breadth of modern geographical enquiry is manifest in the number of oral and poster sessions at the annual meeting. This year in Boston there will be almost 1,800 various sessions. I find this incredible. Surely there will be a plethora of sessions that will appeal to any geographer.