William Blomstedt

Education: Bachelor’s degree in Geography (Dartmouth University), MSc in Geographical Information Science (University of Edinburgh)

The following includes an interview conducted with two colleagues at Webster Pacific. Although the conversation with both William Blomstedt and Tom Paper is included below, a duplicate profile is also available for Tom Paper, who is Managing Partner at Webster Pacific.

It was compiled by Jessica Embury (San Diego State University) for the Encoding Geography initiative. To learn more, visit: https://www.ncrge.org/encoding-geography/


Please describe your job, employer, and the primary tasks that you perform in your position. 

Tom Paper (TP): Our company is Webster Pacific and we provide analytical consulting services. We’ve been in business for almost 20 years and our clients are in a wide range of industries. I used to be a strategy consultant at Bain and Company a long time ago.   

We use tools like Python, ArcGIS, Tableau/PowerBI, CRM/ERP, Cloud Databases, and SQL Server to perform coding, geo-analysis, marketing analytics, web scraping/research, interviewing, and financial analysis. I can’t use any of these programs but I understand the logic of all the work that we do, much of which is geocomputational. 

William, do you want to add anything? You have a background in geoscience. 

William Blomstedt (WB): I studied geography as an undergrad and then I did a master’s course in GIS so I came to the field that way. Tom, geospatially, you only started more recently doing geospatial stuff? The work evolved to geospatial analysis. 

TP: That’s right, seven years ago, one of our clients – a private school based in Manhattan – wanted to open up schools in cities all over the world and asked us to help them analyze cities as opportunities for locating new schools. And that’s what launched us. We evolved our geospatial capabilities for this particular client to help other clients and other schools think geospatially about new locations. We just helped a preschool in Washington DC and we also helped a private school think about why a location in San Francisco had not been performing as well. 

What is your educational background and how did you initially discover geocomputation and ultimately choose a career using geography and computer science? 

TP: My background was liberal arts. I studied economics and environmental studies at Williams and so I don’t know whether the career chose me or if I chose the career. It feels a little bit like it chose me. I think for William – he chose it, he was more curious geospatially early on.  

In the last five years, pretty much since we started geospatial analytics, I got interested in antique maps and that process of discovery. I think there’s a very real thread between our work and the kind of work that people did to think about exploration. For example, I have a map of California as an island from the 17th century. I think it was George Box who said, “All models are wrong, but some are useful.” Examples of things being wrong fascinate me because we see that every day, or we know our models are wrong, but the question is whether they are helpful. 

When thinking about geography, what specific background knowledge and conceptual ideas do you think are important and useful? 

TP: I think that the ability to think in the weeds and then to think about the forest is the most important skill that we have. To be able to go back and forth between details and the big picture. I don’t have a geographic education but I think that ability is critical to what we do every day.  

WB: When I was choosing to go to school to pursue geography, someone told me that you could take a GIS course that just teaches you how to use the program and do GIS. However, they advised me to go to a course where you do a thesis where you have to solve a problem, and GIS is the tool. Instead of just learning the tool, you need to use the tool to do something with it and think about the big picture, rather than just doing geographical analysis. 

When thinking about computer science, what specific background knowledge and conceptual ideas do you think are important and useful? 

TP: I think the willingness to accept that you don’t know everything and that there are things that we still learn. Repeatedly, we learn things and how to do things that we didn’t know before, so I think the willingness to accept that you don’t know everything is critically important.  

Can you mention any procedural knowledge that you think is particularly useful from the standpoint of either geography or computer science? 

TP: We see geography and computer science, or geospatial, like they’re melded together: geography and computer science and our use of programs.  

We use Excel and Google Sheets all the time because it’s how we get into the details and also get to the big picture. Now we’ve had a lot of young people join our firm and want to use Python instead of Excel. I’m not sure I would say that I have embraced it, but I can see the power of it. No matter how programmatic they get, it is important that our team understands how to come back to the larger questions and more conceptual ways of displaying what we’re doing.  

We’re fortunate in the sense that we are driven by our client and their strategy. Every client has a different definition of what is a customer to them and their market position. The priorities are the activities that support that market position and determine who is a customer, and how to spatially define a customer in a particular space. We often think about time. We do find that mileage is not good because a mile in New York City and a mile in Los Angeles are very different due to the time it takes people to get to and from things.  

What’s an example of a social, economic, environmental or other issue that you recently investigated in a project? 

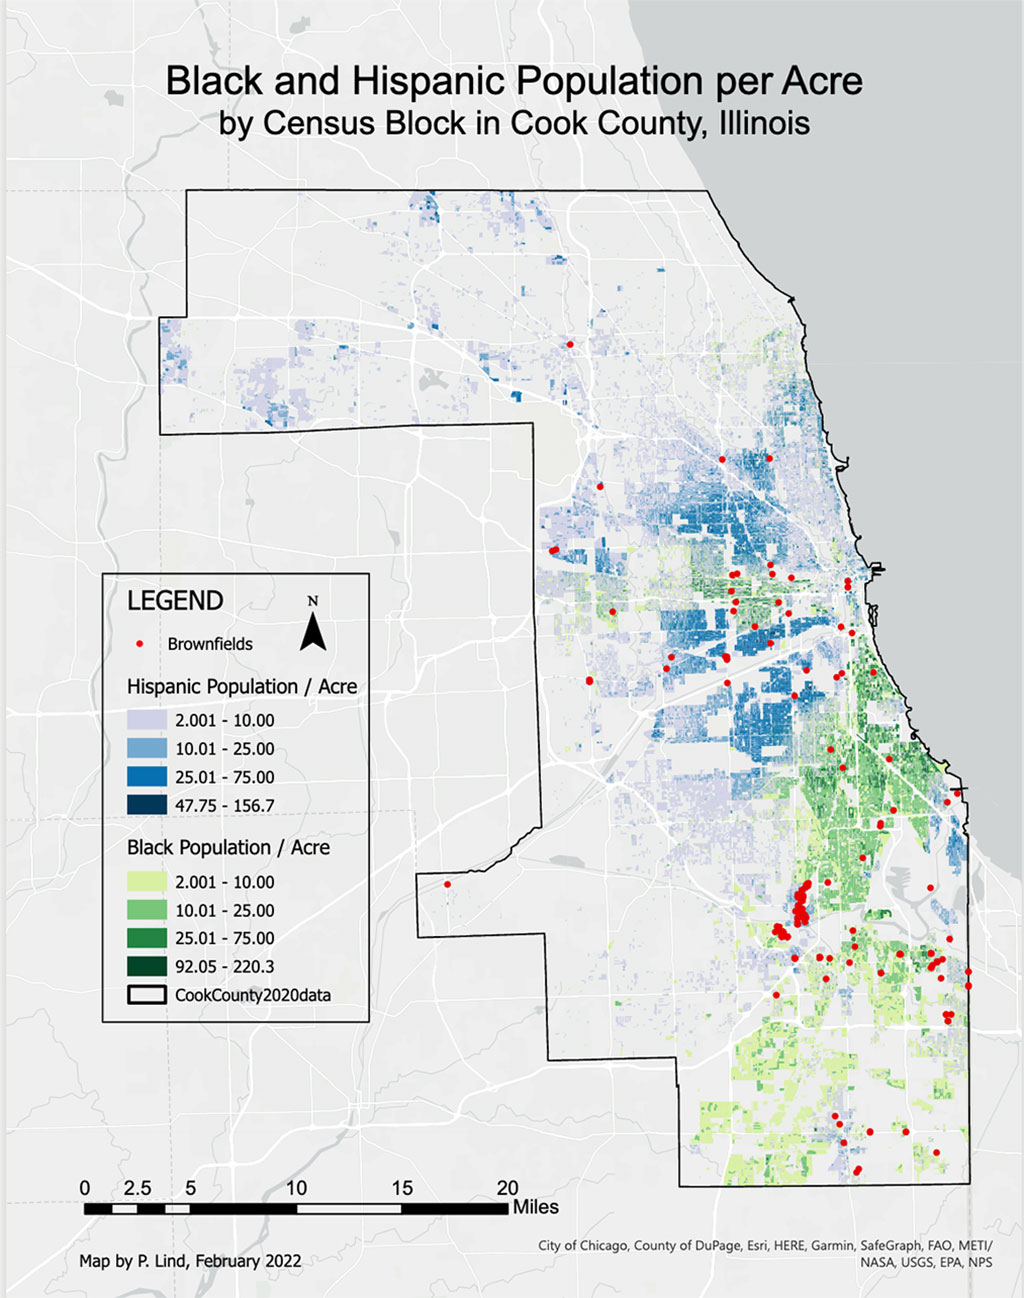
TP: Our client wanted to find a location within a metropolitan area and the customers who would go to their store. Customers are only willing to travel so far. So we wanted to locate in a place where there’s more demand than competing supply for this company. We created a map to show demand and supply in the market. The basic point was to figure out where there’s more demand than supply. Geospatially, where does that exist? We took the demand and subtracted out the supply to get our answer. If all you were doing was looking at the demand, you’d get an answer that looks very different.  

What kind of questions did you ask and think about during this project? 

WB: It’s all about location, place, and interconnection. If we need to write a code or an algorithm, we do it to either iterate faster or to make a model. For a simple supply model, we can say the supply is all in one point. In a more complex model, we will say the supply is not exactly in that point but it’s around that point (e.g. within 10 minutes) and so we have to build a model which spreads that supply out and then computationally figure out where all the supply is.  

What types of data did you acquire to support your project, and are you able to identify up to three data sets that you use frequently? 

TP: We use Census data a lot.  

WB: American Community Survey. 

TP: We use lists of schools or stores on the web. Our client will also have data about their customers and information that we will integrate into our analysis.   

But Census data is by far the biggest one. For the census data, we deal with shapefiles. Sometimes we get data by Block Group, Census Tract, county, or something else. Then, we have to turn that data into data that meshes with us.   

We use road network data sometimes. We used to build our own road networks, and now we use outside services who have data about traffic speeds. Road networks are really important to conceptualize something timewise. Sometimes we’ve thought about not just drive time but walk time or subway time. We analyzed some things in Tokyo once and we had to make a road network, if you will, that was based upon subway travel times. 

What types of content knowledge and skills did you use to evaluate, process, and analyze the data you gathered for your project? 

TP: I have a whole presentation, called the consulting toolkit, about the kinds of thinking that we have to go through to work successfully. People don’t necessarily know all the data that they’re going to need and they don’t necessarily have all the skills to solve a problem, so being able to pick things up quickly is really important.  

We’ve talked in our firm about letting the data guide you and being careful to let the data explain to you what it says. Our customers have questions and we need to be careful to not over interpret the data or over explain the data.   

We always have to look at the work that we’ve done and ask whether it makes sense. Sometimes it doesn’t make sense because we made a mistake. There are so many calculations involved in what we do, so we need to go back and see if we made a mistake. For example, William and I just got through with a particular city and there was a pocket of demand close to the core area. It didn’t make sense to us that it would exist there, so we went back and checked the calculations and discovered that there was a river creating a barrier. So, in this case, there was a geospatial reason.   

How did you apply geography and computer science to communicate the results of your project?  

Webster Pacific map showing a retail fashion client a comparison of the stores in which they and their competitors are located.

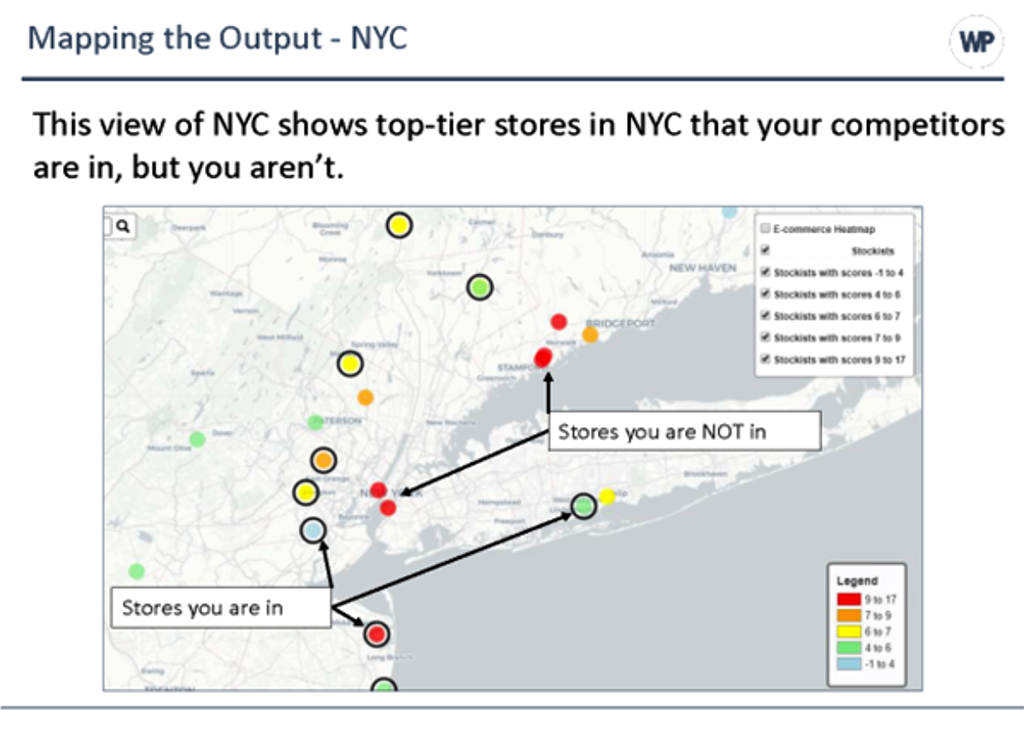
TP: This map is for a retail fashion company. They sell their products to wholesalers who resell the product to consumers. They wanted to know which stores (wholesalers) they should sell their product to, so we found out where the competitors were located. 

That’s the coloration of the dots. Every dot is a store and the reddest dots have the most competitors located inside of them. The black circle around the dots indicate stores where our client is located. Our client was in only one store where there were a whole bunch of competitors and they were in a lot of stores with smaller numbers of competitors. So maybe the client should be in the other red dots, whereas we might not want to be in these green stores as much. 

So this is an example about displaying our results. We try to think about the ease with which somebody who knows nothing about this could understand it. How hard are we making the viewer work to understand our results and how much mental effort do they have to expend? That’s an information design problem. It’s a bit of an art and a science. The best presentations are the ones that take the least effort to understand while still projecting the appropriate amount of complexity. You have to get the answer across with the least amount of work for the viewer. 

Reflecting on your work, how does it align with personal values and community or civic interests? 

TP: We work for clients who want to serve their customers and make money, and I appreciate helping our clients and being paid for doing that work. Are we saving the world with our work? Probably not, but we are supporting ourselves, our families, and our clients. There are certain clients that I wouldn’t work for because their values don’t align with ours.  

I feel good about our work. We have a great team that appreciates the adventure, discovery, and services that we give to our clients. We have school clients and we’re proud of helping them do a better job of educating their students.  

We get paid to do this really interesting work. I tell people I don’t travel around the world physically, but I do in my brain. We get to discover things and we learn – and that is part of the great wonder and joy of this work. We get to learn all the time. There are all sorts of discoveries happening in these realms that I think equate back to when these people were making antique maps and discovering the shape of California. We’re discovering the shape of things that exist. Where is our demand? Where are our competitors? Where should we go? Where should we advertise? So there’s discovery, and that’s fun. 


This material is based upon work supported by the National Science Foundation under Grants No. 2031418, 2031407, and 2031380 (Collaborative Research: Encoding Geography – Scaling up an RPP to achieve inclusive geocomputational education). Any opinions, findings, and conclusions or recommendations expressed in this material are those of the author(s) and do not necessarily reflect the views of the National Science Foundation 


    Share

John D. Nystuen

Professor John D. Nystuen, Ph.D., 91, of Ann Arbor Michigan, passed away on July 2, 2022 at his long-time home on Olivia Avenue in Ann Arbor.

After graduating from Oroville High School in Northern California in 1948 he moved to Berkeley and the University of California, completing a Bachelor of Arts degree in Geography in 1953. Immediately after graduating, he finished ROTC training as a Second Lieutenant in the Army Artillery, serving two years at Misawa Airbase in Northern Japan. In 1955 he earned a Master’s degree and Doctorate in Geography from the University of Washington in Seattle. John’s professional career began in 1959 at the University of Michigan in Ann Arbor in the Department of Geography, and later he worked in the Taubman College of Architecture and Urban Planning. John educated a world of doctoral students. He was the chair for more than 70 Ph.D. students from around the globe. Many of his students comment on how much they learned from him and how supportive and caring they found him to be in their intellectual development. Indeed, Gwen notes how John often said that he had learned a lot from his students, as well. He was a master of the one-on-one educational experience. He implemented his belief in interactive educational interchange long before it became fashionable.

John was a leader not only in the mentoring arena but also in the research arena. As one of the first ‘space cadets’ in the quantitative revolution in geography, originated at the University of Washington in Seattle, John retained a lifelong curiosity not only about traditional geographic inquiry but also about the role of the geographer in studying evolving dynamical systems as applied both on the Earth and in the heavens above.

He published numerous books and articles with citations available in major citation indexing services. Many of his publications are archived in Deep Blue, the online persistent digital repository of The University of Michigan. He served in advisory capacities on academic boards specific to mathematical geography (first on that of the Michigan Interuniversity Community of Mathematical Geographers and subsequently on that of the Institute of Mathematical Geography).

In the early 1960s John and Gwen, his wife, met with the seven Sierra Club members who lived in Ann Arbor (out of the 40 who lived in Michigan). They began meeting regularly, going on outings, and working on conservation issues. John was active in recruiting students and faculty from his and related departments. By 1967 they had a large enough membership to become a local Sierra Club group and ultimately formed the state chapter in Michigan. Over the succeeding years, John continued his work on local and state issues — contributing to our local Natural Features Inventory and supporting Gwen in an amphibian survey in local ponds. John also contributed his photography and sketching skills to many local conservation efforts.

John is survived by his wife of 67 years, Gwen Nystuen, and their daughter, Dr. Leslie Ann Nystuen, M.D. [Peter Leopold], sister-in-law Gaile Hoffman [Augustus] of Oakland, California, and nieces and nephews in California, Washington, New Mexico, Canada and Australia.

    Share

Chaz Olloqui

Education: Bachelor’s degree in Geography: Geographic Information Science (San Diego State University)

The following profile was compiled by Jessica Embury (San Diego State University) for the Encoding Geography initiative. To learn more, visit: https://www.ncrge.org/encoding-geography/


Please describe your job, employer, and the primary tasks you perform in your position.  

I am a GIS Specialist at the City of Oceanside Water Utilities Department. I am directly responsible for coordinating the collection of data among various departments and teams and managing the data collected. I often automate tedious tasks in order to build efficient workflows and processes for the collection of data and presentation of information.    

What is your educational background? How did you initially discover geocomputation  and why did you ultimately choose a career that uses geography and computer science?  

I chose to pursue an education in GIS because I was interested in making a positive change in our natural environment. I had aimed to leverage GIS to strengthen my environmental studies and I had come to realize that it was extremely important to have a technical skill set. It was not enough to know how to make maps and I began to learn python coding. This is when I realized the importance of data design and I expanded my toolset by learning SQL. These skills could be applied to many different fields of study, and I utilize them daily in local government.   

When thinking about geography, what specific background knowledge and conceptual ideas are important and useful to know?  

Knowing the fundamentals of Geographic and Projected coordinate systems can be useful when handling data. This is a foundational GIS concept but can be more complex than some GIS professionals would like to admit.    

When thinking about computer science, what specific background knowledge and conceptual ideas are important and useful to know?  

Data design is key. The correct data types must be considered when attempting to integrate computer science with GIS programs like Esri software.   

What procedural knowledge is important and useful to know, from either geography or computer science?   

Data cleanliness is important and having standard operating procedures for the collection of that data can make the difference between having reliable or unreliable data.  

What is an example of a social, economic, environmental, or other issue that you have recently investigated in a project at work?  

I assisted the Homeless Outreach Team in developing a survey application to better identify homeless individuals who are qualified for assistance programs. The surveys are submitted to a database and have auto-calculated fields using SQL triggers to help create more usable and robust datasets so that decision makers are more informed.   

What types of questions did you ask and think about in your project? 

I was interested in identifying hot spots of homelessness within the city and why those areas are as such. Temporal scales were considered when designing the dataset in order to have a better snapshot of the current situation. Surveys older than six months are archived using scheduled scripts. Analysis of regional interconnectedness is ongoing, and many questions are beginning to arise, both geographically and programmatically.    

What types of data did you acquire to support your project? If possible, please identify up to three datasets you utilize most.  

We utilized zoning datasets to identify responsible agencies that are required to respond to homeless activity. Districting datasets were also utilized to assign volunteers to regions of the city with more homelessness during the homeless point-in-time count.   

What types of content knowledge and skills did you use to evaluate, process, and analyze the data you gathered for your project?  

While analyzing the survey data, it was imperative that null and ‘declined’ values were accounted for to not skew the statistics. The data, or lack thereof, had to be presented succinctly.   

How did you apply geography and computer science to communicate the results of your project?  

I created an Esri Dashboard for the Homeless Outreach Team to view the live data collected in the field, which allows supervisors to observe homeless statistics and track their team’s progress.  

Reflecting on your work, how does it align with your personal values and your community or civic interests?  

I want to do everything I can to make my community better. I believe I have the power to influence change when leveraging my GIS skills and can apply my geographic and computational expertise to a multitude of different issues. 


This material is based upon work supported by the National Science Foundation under Grants No. 2031418, 2031407, and 2031380 (Collaborative Research: Encoding Geography – Scaling up an RPP to achieve inclusive geocomputational education). Any opinions, findings, and conclusions or recommendations expressed in this material are those of the author(s) and do not necessarily reflect the views of the National Science Foundation 


    Share

Hsiao-Chien Shih

Education: PhD in Geography (San Diego State University, UC Santa Barbara), MS in Geographic Information Science (San Diego State University), BA in Geography (National Taiwan Normal University)

The following profile was compiled by Jessica Embury (San Diego State University) for the Encoding Geography initiative. To learn more, visit: https://www.ncrge.org/encoding-geography/


Please describe your job, employer, and the primary tasks you perform in your position. 

I am a data scientist at E Source, a utility consulting firm that helps clients in a data-science-as-a-service manner. Our main task is to reduce power outage risk. My job tasks include acquiring, exploring, extracting, and transforming geospatial (and sometimes time series) data, including remotely sensed imagery, elevation, land cover, and utility assets as inputs for data science and modeling. In addition, I compile and aggregate the output risk in a geographic data format.  

What is your educational background? How did you initially discover geocomputation and why did you ultimately choose a career that uses geography and computer science? 

I am a geographer and I have doctoral, master’s, and bachelor’s degrees in Geography. My initial discovery of geocomputation came from an introductory level GIS course during my undergraduate period. I kept taking other geospatial courses, including remote sensing and spatial statistics. I found my abilities in math and reasoning made geocomputation attractive. Besides, geographic information represents real-world big datasets that can be used to solve real-world problems. Thus, I aimed to work in this field for my career. 

When thinking about geography, what specific background knowledge and conceptual ideas are important and useful to know? 

I tend to emphasize the absolute and relative geographic locations of a phenomenon, and then I shift my attention to the associated spatial distribution and temporal dynamics. The spatial-temporal process always attracts me, and I am interested in the background mechanisms of the process. For example, the spatial-temporal processes of urbanization were my dissertation topic. 

When thinking about computer science, what specific background knowledge and conceptual ideas are important and useful to know? 

Programming skills are critical for handling large amounts of data iteratively. Machine learning and its associated applications are critical to the work I perform. With the understanding of various sources of data and their caveats, I compile data to create critical inputs for machine learning. Finally, cloud computing is critical for the current job market due to the nature of largevolume geospatial data.  

What procedural knowledge is important and useful to know, from either geography or computer science? 

Knowing how to handle (read/write) geospatial data is necessary. Understanding approaches to analyze raster, vector, or point cloud data significantly contributes to the current utility consulting industry. 

What is an example of a social, economic, environmental, or other issue that you have recently investigated in a project at work? 

My colleague and I regularly work to estimate and reduce power outage risks due to environmental effects. We monitor vegetation growth based on remotely sensed data around utility assets, and then provide feedback to our clients for prioritizing vegetation management. To accomplish this task, we need to know how to compile remotely sensed, elevation, and other sources of data for monitoring the environment. Thus, knowledge of remote sensing, image processing, geometry calculation, spatial analysis, and machine learning are necessary.  

What kind of questions did you ask and think about during this project? 

For the above task, we consider the spatial scale and resolution of multiple sources of data. It is important to know how to incorporate data across multiple scales and what each scale represents in terms of the data source. We often calculate the relative location between any two objects to understand the risk of power outage. Therefore, calculating geometry is necessary. In addition, we need to know how to compile these data programmatically and we need to know some graph theory to boost the computation speed. 

What types of data did you acquire to support your project? Please identify up to three datasets you utilize most. 

Multiple sources of data are often used in our projects, and most of the data are publicly accessible. First, utility data will be used to define the geographic coverage of territories, and samples will be generated from the proximity areas of the data. We also use multiple sources of remotely sensed data, including Sentinel-2 and NAIP, as well as elevation data, such as LiDAR and the national hydrology dataset. Recently, we started using commercial satellite imagery (e.g. Planetscope data). 

What types of content knowledge and skills did you use to evaluate, process, and analyze the data you gathered for your project? 

Several skills are critical. First, knowledge of remote sensing and associated image processing approaches are necessary. Specifically, image spectrum analysis and image preprocessing are helpful. Second, machine learning knowledge is another must-have skill for data preparation and data quality confirmation, including classification and clustering. Finally, cloud computing is a nice-to-have skill because we often handle humongous amounts of data (e.g. AWS Sagemaker and S3). 

How did you apply geography and computer science to communicate the results of your project?  Do you have a recent product or publication that you could share with us as an example? 

We usually use python and QGIS for data visualization, and we use python for data compilation. Specifically, we rely on open-source python libraries (e.g.gdal) to handle geospatial data and create big data tables. Machine learning classification and regression are applied to estimate outage risks. Then, we create web-based apps to visualize the risk of power outage for our clients. 

Here is the link to our publication: https://www.esource.com/001201rt0d/data-science-company-improves-vegetation-management 

Reflecting on your work, how does it align with your personal values and your community or civic interests?  

I often think about how my learning during my undergraduate and graduate studies can contribute to a better world, especially in urban areas. The knowledge of remote sensing, GIS, and geocomputation perfectly helps me achieve the goal of moving the world toward a decarbonizing future. I am glad that I can apply my knowledge in the utility industry.  


This material is based upon work supported by the National Science Foundation under Grants No. 2031418, 2031407, and 2031380 (Collaborative Research: Encoding Geography – Scaling up an RPP to achieve inclusive geocomputational education). Any opinions, findings, and conclusions or recommendations expressed in this material are those of the author(s) and do not necessarily reflect the views of the National Science Foundation 


    Share

Carmen Leedham

Education: B.A. in Geography (San Diego State University)

The following profile was compiled by Jessica Embury (San Diego State University) for the Encoding Geography initiative. To learn more, visit: https://www.ncrge.org/encoding-geography/


Please describe your job, employer, and the primary tasks you perform in your position. 

I work for the County of San Diego, Health and Human Services Agency in the Office of Business Intelligence. The office I work for is a support department that works with other offices within the Health and Human Services Agency, such as Aging and Independent Services and Public Health Services. The primary tasks I perform revolve around GIS. I create static maps, web maps, and perform geospatial analysis to answer questions posed by leadership and my coworkers. For example, I performed geospatial analysis to convert tabular data into spatial data to answer, “How many CalFresh recipients live in each district in the County of San Diego?”  

What is your educational background? How did you initially discover geocomputation and why did you ultimately choose a career that uses geography and computer science? 

The people I met during my education have been instrumental in the trajectory of my career and have been very important to me. I first came into contact with geocomputation after completing a cultural geography course at Grossmont College with Professor Mark Goodman. He told me what a career in geography might look like and he encouraged me to enroll in an “Intro to GIS” course. At first, I did not understand anything, but the professors were so helpful and they made time for their students. I never had any computer classes in high school or middle school so learning how to work with a computer was very new to me. 

About a year later, I applied for an internship with the County of San Diego, Health and Human Services Agency in GIS. From there, I started to learn important skills, like how to work in a professional office, how to email people, and how to communicate with people in a professional setting. I started to really like it and see a life for myself working in GIS for a local government.   

At the time, I was 18 or 19 and I was going through a lot – I had unstable housing and food insecurity. I wasn’t sure how I was going to make it day-to-day or month-to-month. I saw GIS as a path to achieve the things I wanted: stable housing and a little bit of fun money. From that point forward, I started thinking about how to get a career in GIS as quickly as possible. In May 2019, I completed the GIS technician certificate of achievement at Mesa College – the requirement to get an entry level job in GIS with the County of San Diego. In September 2019, I got a full-time job with the County of San Diego in the Land Use and Environment Group. Since then, I’ve been with the County of San Diego, moving up and honing my skills in GIS.  

When thinking about geography, what specific background knowledge and conceptual ideas are important and useful to know? 

I feel like geography – both physical and cultural geography – cannot be separated from GIS or geocomputation. The foundation of geospatial analysis builds upon cultural and human relation to place and space throughout time. Likewise, GIS builds upon physical geography and knowledge of our surroundings.  

I mainly focus on cultural geography and the socioeconomic conditions of people within the Health and Human Services Agency of the County of San Diego. So, with geocomputation, we run the risk of turning people, plants, and places into numbers or into commodities and binaries. Through geography, we can return people from numbers and binaries back into real life things that have special life circumstances and value to one another.  

Conceptually, an understanding of sustainability should be gathered prior to working in geocomputation. Our actions have consequences, both positive and adverse, and this is something we should take into consideration in our day-to-day interactions. Our work always revolves around the three pillars of sustainability: people, profit, and planet.  

When thinking about computer science, what specific background knowledge and conceptual ideas do you think are important and useful to know? 

I recommend starting with the basics like: What are hard drives? What are the different types of hard drives and what do they do? What is the central processing unit of a computer? What’s a good one or a bad one? How much memory does the computer or device have?   

Then, you need to understand different types of software. Think about your needs and what software can meet the questions posed by your research. From there, you have to learn how to use the software. What file type does the software use? How are these files opened in the software? How are they saved on your computer?   

When I started GIS, I went to buy a laptop and I thought, “Okay, I need something that can handle the amount of data I’m going to be running and the strain I’m going to be putting on my computer.” I had to look at things like core memory and plan accordingly, because there are times that your computer will be overworked.  

What procedural knowledge is important to know, from either geography or computer science, in your work? 

It is important to know how to isolate your question, so things like the scientific method can be helpful. You don’t need to follow it exactly, but it can help you identify methodology to solve the question. What information do I need to solve this problem? Does this information exist in the format I need and, if not, can I create this information or do I know someone that can assist me in gathering this information? 

From there, test your methodology. Be flexible because a lot of things aren’t going to work and you need a plan B, C, D, and so on. It’s very helpful to know people within your line of work so you can ask questions and be nudged along in the direction you need.  

Can you share a specific example of how you apply geography and computer science to analyze and solve problems related to important issues?  

Since March 2020, when the novel coronavirus entered the United States, the County of San Diego tried to get ahead of it. We had public health scares in the past, like the Hepatitis A outbreak, so we had a little bit of a framework. 

My office develops and maintains a publicly available web map application for locations with publicly funded hand washing stations and public restrooms targeted for use by individuals experiencing homelessness. The County of San Diego hoped to prevent the spread of COVID-19 by placing hand washing stations and portable restrooms in locations that have known homeless encampment sites.  

What kind of geographic questions did you ask and think about during this project?  

The Office of Business Intelligence did not have to decide where the washing stations would go, but we relied on spatial data about homeless encampments to show hotspots and clusters of people experiencing homelessness.  

Someone else using this data would say, “Let’s place a hand washing station on this street where there are a lot of people experiencing homelessness,” and from there, I would receive the name of the street that this hand washing station is on and other internal information, such as how long it will be serviced or problems with the station itself. I would then convert this tabular data into spatial data. Addresses are not spatial data because there are no latitude or longitude coordinates connected to them. These coordinates are necessary to perform geocomputation, otherwise, it’s just data on your computer.  

We ended up creating a public web map application. I published the data as a hosted feature service on ArcGIS Online and I update it every so often. I had to think about possible problems with sharing this data with a large audience. We didn’t know how many people from the public would be looking at this map and a lot of pings could cause the map to be slow or stop working. I had to think of these problems ahead of time because if this map were to go down then the public would ask questions.   

In doing this project, I had to understand the software I was working with and the data formats. I had to think about whether the public would have problems viewing the map, and whether the data was understandable and digestible to the audience.  

What types of data did you acquire to support your project? Please identify up to three data sets that you utilize the most. 

I frequently perform geocoding to assign latitude and longitude to an address using an address locator. An address locator consists of different road networks of polylines within an area. For example, SANDAG publishes a dataset called “roads_all” that contains road types, road names, and address ranges. The address locator matches the tabular address data to spatial data in the road network and then converts the tabular data into spatial data. 

Since we have so many geocoding requests, we work on building the best address locator to match with the most addresses in the least amount of time and with the highest accuracy. We use “roads_all” from SANDAG as well as a road network from ESRI. We also use TIGER/Line shapefiles from the US Census Bureau because sometimes people have mailing addresses outside of the County of San Diego. I combined these road network datasets to produce a composite address locator that I worked with daily for this project. I also used the point in time homeless count from the San Diego Regional Task Force on Homelessness as well as internal data sent by my coworkers in neighboring offices. 

What types of content, knowledge, and skills did you use to evaluate the project and analyze the data gathered for your project? 

Something I wasn’t prepared for was the amount of general skills, like Excel and Word, needed to perform day-to-day tasks. Communication is another huge part of my job, so I have to understand the needs of the project, the questions answered by the project, and how to provide deliverables to the customer. The customer could be one of my coworkers in an office or it can be the public. 

With the hand washing stations and portable restrooms web map, I needed to make sure that the data was always up to date and that the data could handle being updated frequently. I needed a huge understanding of ArcGIS Online and that suite of products. Another aspect was working with firewalls. I work in a secure network that the public cannot access, so I needed to get private data to the public and ensure that it met requirements to share with the public.   

More specific skills I used are geocoding, creating an address locator, creating web maps, and creating web applications. 

How did you apply geography and computer science to communicate the results of your project? Do you have a recent product or publication that you could share with us as an example? 

https://211sandiego.org/covid19/covid-19-information/ 

The web map of hand washing stations and portable restrooms is on 211 San Diego and contains hand washing station icons and portable restroom icons. Using this map, you can enter an address to see where the nearest hand washing station or portable restroom is. You can click on an icon and get additional pop-up information.   

To create this map, I had to use Excel, bring the Excel spreadsheet into ArcGIS Pro, geocode the data set with my composite address locator, create a feature class in my geodatabase, and publish it online for the public to view. Once published on ArcGIS Online, the data is stored in the cloud and is referred to as a hosted feature service. I had to ensure the sharing capabilities were correct so other people – like students – can bring this data into their own maps. Then, I had to make sure that there were no technical problems on the backend which would make the map stop working.  

When reflecting on your work, how does it align with your personal values and your community/civic interests? 

I used to be a customer of the County of San Diego and I used to receive CalFresh. I saw how the County of San Diego helped me, I see how it helps other people who are in that situation, and I know that some good is being done. That is rewarding to me. The things that I care about are making sure that people are able to live well and thrive, rather than just survive and get by. It’s nice to know that there is a group of people working to make sure that the basic needs of our community are met, and that resources are available. 

For me, public web maps are key because we can show the public that there are resources available. People don’t always know what’s available to them and we need to share the work that we’re doing and what the County of San Diego provides. I like working for an organization that is helping people and making sure that things are working as they should be. It makes me feel good — like harm reduction is occurring.   


This material is based upon work supported by the National Science Foundation under Grants No. 2031418, 2031407, and 2031380 (Collaborative Research: Encoding Geography – Scaling up an RPP to achieve inclusive geocomputational education). Any opinions, findings, and conclusions or recommendations expressed in this material are those of the author(s) and do not necessarily reflect the views of the National Science Foundation 


    Share

Edward Fernald

Edward Arthur Fernald, 90, retired Professor Emeritus of Geography and Associate Vice President of Florida State University, passed away on June 18, 2022 in Tallahassee. He was born on January 31, 1932 in Bradenton, Florida. His parents were Francis Gordon and Rebecca Jane Fernald. He is preceded in death by his wife of 67 years, Jean Kathryn Martin Fernald, and brother, Harry Fernald. He is survived by two sons, Thomas Edward Fernald (Cindy) of Tallahassee and Gary Martin Fernald (Kim) of St Petersburg, and one daughter, Joy Kathryn Portero of Tallahassee. He is also survived by six grandchildren: Ashlyn Portero of London, UK, Sarah Fernald Miller (Josh) and Amberly Portero of Tallahassee, Scott and Emma Fernald of St. Petersburg, FL, and Rebecca Fernald Groves (Dakota) of Denver, CO, and 2 great-granddaughters, Caroline and Kate Miller.

Portrait of Edward Fernald working on maps at his deskEd graduated from Manatee County High School, Bradenton in 1949, where he also taught from 1957 to 1960. He was an Eagle Scout, and a member of the first National Championship team in gymnastics at Florida State University. Ed served in the U.S. Navy four years, including a tour in the Far East on the aircraft carrier Yorktown. He received bachelor’s and master’s degrees from FSU and a Ph.D. in geography from Michigan State University. Ed began teaching at Florida High in 1960 and transferred to the FSU Geography Department in 1967. During a 38-year career of teaching and administration at FSU, he founded and was Director of the Institute of Science and Public Affairs which included 17 centers for research and service.

Ed was very active in his profession on both the state and national levels. He served as president of the Florida Society of Geographers and the National Council for Geographic Education. In addition, he served as State Geographer of Florida for over 30 years; eight years on the Leon/Tallahassee Planning Commission; member of the U.S. State Department Directorate on Man and Biosphere (28 years); chaired the Florida Board on Geographic Names (10 years); and developed and chaired the Florida Geographic Alliance (30 years). His work with the U.S. State Department and the National Geographic Society took him to 45 countries. Among his books written and edited are Atlas of Florida (2 editions), Water Atlas of Florida (2 editions), Florida: Problems and Prospects, and Florida: Heritage and Horizons. He was quick to point out that the only way to get so much done was to have bright, hard-working colleagues carrying much of the load.

Ed was a member of First Baptist Church, serving as a deacon and Sunday School teacher. He acknowledged his dependence on Jesus, his Savior, and his faith in the statement from Philippians 1:21, “To live is Christ, to die is gain.”


Reprinted with permission from Dignity Memorial.

    Share

Johannes Feddema

Professor Johannes Feddema passed away on January 31, 2022 after a 2-year battle with stomach cancer. Johan was a proud Frieslander, growing up in a rural dairy community in the (Ferwerd) Netherlands for his first 10 years. His parents worked for the Dutch development agency in Kenya (Nakuru, 7 years), Rwanda (Butare and Kigali, 6 years), Pakistan (Peshawar, 3 years), and Tunisia (Bizerte, 3 years). He took every opportunity to accompany his father to a wide variety of development activities across these countries. As part of this upbringing, he also traveled extensively and spent much time in wildlife areas, national parks, and cultural locations in these countries. Because of these experiences, he started University with an interest in marine biology and conservation science, and finished with a double major in Biology and Geography, emphasizing ecology and climate studies. His interest in climate studies was the direct result of a water balance climate course he took that vividly demonstrated the link between water resources and agricultural production, which was made especially impactful because he had been in Rwanda and witnessed a mass starvation event due to rain failures. Johan then completed an MS degree in Geography, focusing on mapping air quality impacts on marble tombstones and monuments in Philadelphia, and then a PhD degree in Climatology from University of Delaware, exploring global climate teleconnections using a water balance methodology.

In the early 1990s, Johan secured a position as an Assistant Professor in the Department of Geography at UCLA. Even as a young professor, he poured his hallmark energy and enthusiasm into his belief that systemic environmental challenges require systemic solutions. To that end, he launched the inaugural course offering, Geography 5, in UCLA’s then newly-founded Institute of the Environment (now Institute of the Environment and Sustainability), established and led by Richard Turco. To properly tackle the inherently cross-cutting theme of “environmental study,” Johan ensured that a broad range of disciplines were represented in the course, and brought in a number of guest lecturers to reflect that thematic integration and breadth. This would come to define his approach to teaching and research throughout his career. Richard Turco remembers Johan as a bold young thinker who recognized the compelling need for interdisciplinary research to devise practical solutions and guide policy action on environmental issues.  He said “Even as a newly appointed and vulnerable UCLA Assistant Professor, Johan reached out to collaborators across the campus, breaching academic barriers at some risk to his own career. We were lucky to have him at UCLA at the time.”

In December of 1998, Johan left UCLA to pursue an opportunity at University of Kanas in the Department of Geography. Johan impressed both students and faculty with his ecumenical approach to geography, and was equally adept at talking with hard-science physical geographers, biogeographers, GIS and remote-sensing specialists, and human geographers. His breadth and enthusiasm served him well in his time at KU by helping bridge differences among the wings of the department, often around environmental themes that many in the department studied in common. In 2003, Johan was instrumental in bringing the Atmospheric Science program at KU from the physics department back into its original home of Geography, where it has been nurtured and has steadily grown over the years. With colleagues from History, Environmental Studies, and English, Johan created a new, year-long, team-taught, truly interdisciplinary and integrative approach to the introduction to environmental studies. This series of courses and labs covered humanist, social science, and natural science approaches to the study of the earth, and holistically satisfied a large number of general education requirements. Over the years, Johan’s interest in others and their work led to collaborations with social scientists, humanists, and artists across campus. He took on several iterations of efforts to reform the various majors within what ultimately was renamed the Geography and Atmospheric Science Department, serving as department Chair from 2012 to 2015. All the while, Johan continued his productive research agenda, always with his eyes on the interdisciplinary connectivity that was central to his integrative vision of Geography. In 1999, he co-led the NSF International Workshop on African Environments at KU, and subsequently (2000-2004) co-directed the US State Department-funded University Affiliation linkage with the University of Zambia. Johan is remembered for his open door, and his enthusiasm, directness, work ethic, and absolute honesty. His smile and genuine, infectious positivity and curiosity helped bring out the best in others. The department still bears the fingerprints of his many accomplishments while he was here.

Johan’s interest in climatology largely focused on using climate science to better understand the human impact of climate change on humans and ecological systems, and also to better understand how humans impact local climates through land cover conversion, hydrologic change, and other factors. This stemmed from his early experiences in Africa and his biology background. Much of this work was developed in modeling frameworks, but as an academic, he took advantage of the liberty to develop these other areas in his teaching, and also through public outreach.  His research also simulated the impact of human activities on climate, especially the nature of the built environment.

His research career started with the use of water balance models to simulate climate impacts on water resources focusing on drought, and he studied the climate impacts of land-use change and human-induced soil degradation. Other work included climate impacts on glaciers in the Himalayas, simulation of fire impacts on forest regeneration in the US southwest, and drought detection and methodological work on climate network issues. To better understand the feedbacks in the coupled human climate system, he began to conduct experiments in Global Climate Models (GCMs).  His most recent work was centered around creating models and databases to assess the impacts of anthropogenic land cover change, urbanization, and soil degradation on climate in the National Center for Atmospheric Research (NCAR) Global Earth System Models.  He published in a variety of journals, including Climate Research, Climate Dynamics, Climatic Change, Urban Climate, the Annals of the Association of American Geographers, and Science, and was a contributing author on the third and fourth IPCC reports. These are some of the most important journals in climate and geographical sciences, and he is well known and respected in the climate and geography fields: based on Google Scholar data, his research has been cited almost 13,000 times.

Johan was a highly motivated mentor, both in the undergraduate setting and for graduate students. He was so eager to share; often was the occasion I was in his office staring down at 50+ slides full of equations for an hour-long time slot, and then seeing his look of pure delight as he reviewed what he was about to share with the second year class. He gave his time freely to students, and not just the grad students under his supervision, but any grad, or indeed, any student, who approached him for help. He was so generous with his time that I had to be careful not to casually engage him when I knew he needed to be otherwise focused, because that is who he was – he would set aside what he was doing to give you his full attention and honest assistance. He spent a lot of time with his graduate students, and mentored his most recent grads at UVic to achieve impressive results.

Beyond mentoring in the academic setting, Johan felt strongly about using his position to advocate and to make a difference. Throughout his career, starting even in graduate school, he was involved in various levels of public engagement on the topic of climate change.  This included outreach to schools from elementary to University level, providing testimony to the Kansas State legislature at the request of the Sierra Club and other environmental organizations, advising several organizations (e.g., Climate and Energy Project in Kansas), and serving on the Kansas Environmental and Energy Policy (KEEP) at the request of the Governor of Kansas. He took opportunities to present climate information to a variety of groups in British Columbia (about 5-6 times annually), with the most influential being presentations to public retirement fund boards (> 1 billion dollars each).  He genuinely enjoyed his outreach activities, and viewed these as a key mechanism by which he could effect change in society.  His approach was generally relatively neutral, and instead focused on the fundamental science concepts and evidence, including a history of the science, and linking peoples’ lived experiences to that evidence. He found this approach especially effective in dealing with more conservative, and often more skeptical, audiences.

Johan was a committed academic leader. He served as department Chair for almost 10 years at both the University of Kansas and the University of Victoria, where he was hired as an external Chair. In both units, his administrative work was marked by strong efforts to increase research capacity, keeping an eye on reputation and strategies to improve rank metrics, while at the same time encouraging a cooperative and healthy culture within the unit. As a leader, he was transparent, persistent, and fair and equitable in the treatment of people. He led and encouraged methods for increasing diversity, with a strong focus on Indigenous knowledge; this came naturally to him, an outgrowth of growing up in Africa. To this end, he oversaw Indigenous hires in both units. Equity was central to his ethos, and he helped guide three – overdue – female faculty members’ promotions to Full Professor rank; there had only been one other such promotion in 50 years.  He also implemented new hiring practices in both institutions to ensure improved access to opportunities for minority candidates. He was a strong proponent of and helped facilitate community-engaged work, and combining this with his interest in Indigenous partnership, he developed significant interactions with Indigenous institutions in both Kansas (e.g., Haskell Nations University) and in British Columbia, where he led a field school in Ahousaht Territory (Flores Island), and initiated a semester-long field school (6 courses) in Tofino that incorporates major community engagement components with local groups (both Indigenous and other).  In general, his broad range of these recent experiences, combined with his exposure to various groups in Africa and Asia, equipped him to be a true leader in academic-Indigenous engagement.

Johannes Feddema was dynamic, creative, highly engaged, and deeply optimistic. He was someone you noticed, and his leadership left a strong impact at UVic. He cared deeply about his family, and his world. His professional world will miss him; Geography, Climate Science, and UVic will miss him; and I will miss him, and hope I can be worthy of his example as Chair. On a personal level, I considered him a friend.  I got to know his family, and knew him to be a loving, supportive, and very proud husband and father.  It pleased and privileged me greatly that I had the opportunity to speak with him remotely for most of the morning on the Saturday before he passed, and I received his last email at 2 am on the Monday morning of his passing. True to form, it was a last tweak of a paper he was working on.


David E Atkinson, Chair, UVic Geography

Other contributors


    Share

Member Profile: Phoebe Lind

Photo of Phoebe Lind

As a dancer and a geographer, Phoebe Lind’s career has been shaped by space and place. Most recently, her work as an enumerator for the U.S. Census Bureau, as a redistricting consultant for the Cook County Board, and as a recent graduate with a Masters degree in Geography and Environmental Sciences from Northeastern Illinois University, Lind has investigated the spatial relationship between environmental hazards and minority communities, and how they collectively inform the redistricting process.  

I‘ve always really enjoyed the science behind maps: how they’re made, how projections work, the way that they can be incredibly insightful to spatial trends of where problems exist in the world.

“I think I changed career paths because the world really needs people studying environmental issues, learning how to sufficiently use this amazing GIS technology that we have today, to start to fix all kinds of complicated problems that we are dealing with.” Lind earned her bachelor’s degree in Dance before deciding to pursue a Masters at NEIU. 

Lind’s academic research was inspired by a nationwide study that correlates the locations and traits of congressional districts relative to minority populations and Superfund sites. She decided to try to replicate the study herself, “or maybe develop a modified set of methods that could allow for this same study to be done on a county wide or similar scale, like a state or a city,” Lind explains, emphasizing the importance of scale. Lind’s own connection to the space she was studying—Cook County, where she lives—became clear as she moved through her research. “The reality for me is that I just have so much information on Cook County. And so much expertise on this redistricting process, because I did it. I did the redistricting process for this round of redistricting. I was an enumerator. I got to collect the data.” 

Phoebe Lind's map showing Black and Latino population locations in Cook County, Illinois

Working on the ground as an enumerator in Cook County during the beleaguered 2020 census did a great deal to inform how she carried out her research. “I had no idea what that job would be like, and it felt like a historic opportunity to kind of jump in and see how the process went. I feel really lucky to have been the one helping. This is important demographic and population data for the country…and then being able to see the other side of that and having input on the redistricting process…it felt like a very important job.”  

Are enough geographers in the room during the redistricting process? Lind thinks not. While processes differ from state to state, more geographers are needed everywhere to discuss the factors at play and help drive insights.  “I think the redistricting process would benefit from more GIS data analysts, and geographers. Politicians may be great at what they do, but they could be missing a lot of things that matter in the redistricting process. GIS is great at pointing those things that seem invisible until you put the table of data on a map and point it out to them saying, ‘this is the data and this is what it looks like spatially.’” 

When asked what she’ll do now that she has received her masters degree, she smiles. “I have a very nice problem where I’m interested in lots of different ways that I can use GIS…but since working with Cook County data, election data and election mapping have also been super interesting…I’m thinking I might want to go a little further with the study [I initiated], to see what I can change, what methods I can tweak. Maybe I can add onto it…because I think it has potential to grow a lot. But that’ll probably serve as kind of a side project to whatever job I end up doing, so the future is a little bit unknown. I’m pretty much just excited about GIS.” 

Find out more about AAG’s initiatives toward Geography for Inclusion 

Learn about AAG’s advocacy for Geography for Inclusion

    Share

Rebecca Grover

Education: M.A. in Geography (San Diego State University) B.A. in Geography, English (University of Vermont)

The following profile was compiled by Brendan Vander Weil (Texas State University) for the Encoding Geography initiative. To learn more, visit: https://www.ncrge.org/encoding-geography/


Please describe your job, employer, and the primary tasks you perform in your position.  

I am self-employed as a GIS analyst and consultant. In this position, I perform a wide variety of tasks to solve analytical problems and provide GIS solutions to clients. Most recently, I provided GIS support for a renewable energy development company. In this role, I ran and maintained a customized tool to extract land that would be suitable for solar energy development. I also provided customized GIS analyses, including a process for displaying areas of neighboring landowners with large acreages of land for potential solar development outreach. I also spent much time searching for and compiling data, such as parcels and endangered species and maintaining a variety of geodatabases for running tools and processes.   

What geographic knowledge, such as terminology and concepts, is important and useful to know in your line of work?   

For a recent client, it was beneficial to know basic physical geography concepts such as the definition of a 100-year flood zone, and knowledge of other FEMA-related data and concepts. In addition, understanding how parcel data is assessed and attributed was important to know as well as basic knowledge of environmental geography, such as state-listed versus federally-listed endangered species.   

What conceptual geographic knowledge is important and useful to know?   

For one renewable energy client, there was a significant element of interconnection and the importance of place as it related to the natural environment. Many different factors – such as the location of land, any constraints on the land, ownership of neighboring land, and governance of land – contributed to identifying potential sites for developing solar energy. Both general knowledge of how location is important to this work, as well as knowledge of environmental considerations, were useful to know.   

What procedural geographic knowledge is important and use to know?  

Knowing GIS and spatial analysis methods was crucial to performing this work as a GIS Analyst. Also, understanding where to look for downloadable spatial data and managing and interpreting said data was key to this role. Having a solid grasp of geoprocessing methods and procedures was also essential, as well as quality-checking and analyzing the results.    

What areas of computer science are important and useful to know?  

Definitely basic computer programming — such as Python (which is used with GIS).   

Can you provide an example of a project where you apply geography and computer science to analyze and solve problems related to important issues? 

For my most recent client, we were constantly looking for new land on which to develop solar energy. Therefore, one of my most common tasks was to run and maintain a customized tool in GIS to extract this developable land – the first step in assessing where to build solar and promote the advancement of renewables.   

What types of geographic questions did you ask and think about in your project?  

Before running the tool, I needed to ensure that the databases that the tool would connect to and iterate through were in the right location with the right datasets. The first question was, are the databases ready, and is all my data there? Next, if there was an error with the tool, I had to discover where the issue was and ask myself whether it was a data issue, a server connection issue, or something else. And when the tool finished running, I needed to examine the output and ask myself if the results made sense – did the flood zone and wetland layers appear to show correctly? Did the developable land align in a sensical way and did not overlap with the constraints layers? Were any data layers missing?   

What types of data did you acquire to support your project?  

I acquired many types of data for my project, with the following being the most critical: 

  • DEM tiles from USGS 
  • 100-year flood zone FEMA data 
  • Wetlands data from FWS 

What types of knowledge and skills, both geographic and general, do you use to evaluate, process, and analyze the data you gather for your work? 

I used my prior knowledge of working with DEMs and the Spatial Analyst extension to effectively download and organize DEM tiles from the USGS site and analyze the resulting slope data. For the 100-year flood zone data from FEMA, I used geoprocessing skills such as extracting data by attribute and exporting data between databases to process and organize the data to be ready for use in the tool. I used similar techniques to prepare the wetlands data. To analyze the output of the tool, I used a variety of content knowledge/skills like interpreting aerial imagery, quality checking spatial and attribute data for accuracy, and problem-solving/error tracking if something did not look right.   

How did you apply geography to communicate the results of your project? Do you have a recent product or publication to share with us as an example?  

The output results of the tool were needed by the client in KMZ (Google Earth) format, so I used skills in spatial analysis and QA/QC to ensure the KMZ file was spatially accurate and displayed properly. If the output KMZ did not look right, I used GIS/spatial analysis skills to correct the data that was input into the tool, or manually alter the tool’s output layers in GIS and re-convert to KMZ.   

Reflecting on your work, how does it align with your aspirations from when you were a student?  

Being able to contribute to advancing the field of renewable energy by working with my most recent client was certainly a step in the right direction for me — ever since I was a student I have aspired to address important social and environmental issues. I hope to take on more clients with this goal in mind, particularly for social causes as I was more human geography focused when I was in graduate school.  


This material is based upon work supported by the National Science Foundation under Grants No. 2031418, 2031407, and 2031380 (Collaborative Research: Encoding Geography – Scaling up an RPP to achieve inclusive geocomputational education). Any opinions, findings, and conclusions or recommendations expressed in this material are those of the author(s) and do not necessarily reflect the views of the National Science Foundation 


    Share

Nikolas Smilovsky

Education: Ph.D. focus on Behavioral Geography and Environmental Perception (Grand Canyon University) M.S. in Geographic Information Systems (Arizona State University), B.A. in History (University of Florida) 

The following profile was compiled by Brendan Vander Weil (Texas State University) for the Encoding Geography initiative. To learn more, visit: https://www.ncrge.org/encoding-geography/


Please describe your job, employer, and the primary tasks you perform in your position.  

I work for a technology company that primarily produces integrated global navigation satellite system (GNSS) solutions for organizations around the world. Bad Elf, LLC is a leader in the global positioning market, being one of the first companies to productize GPS devices that plug into smart devices, a new type of technology referred to as the “bring your own device” market.  As the Director of Geospatial Solutions, I specifically work with customers that have field data collection needs. I help put together best practice training sessions and solutions for their organization based on specific needs. Working with various stakeholders, I ensure success whether that is profitability, time savings, or other more altruistic goals.  

What geographic knowledge, such as terminology and concepts, is important and useful to know in your line of work?  

Having a general understanding of geographic concepts is important, because all of my customers, clients, and partners are involved with something geospatial. It is also important to understand the technology associated with geography. For example, understanding geographic information systems (GIS), computer-aided drafting and design (CADD) software, light detection and ranging (LiDAR) hardware, or unmanned aerial vehicles (UAVs) aka drones have more applicability for Bad Elf. Additionally, understanding the science and math aka geodesy, underneath the geographic concept is paramount.  

What procedural geographic knowledge, such as spatial analysis using GIS or collecting spatial data, is important for you to know?  

Being able to leverage Bad Elf data collection devices to populate geodata repositories is what we do daily. One of my roles is to support customers that have goals of collecting high fidelity field data. This data is often used in analysis and or geographic inquiry. For example, I work with universities, government agencies, national laboratories, engineering firms, environmental consultants, land surveyors, biologists, planners, arborists, and architects who all do some type of procedural geographic tasks.   

Can you provide an example of a project where you apply geography and computer science to analyze and solve problems related to important issues? 

While I don’t often directly deal with solving important end-game issues, I do help the people that are breaking industry chains and are doing significant research/application. In a sense, I get to support the efforts intrinsically through my support. What is also extremely important to me, is that I get to help a wide plethora of people do better geography. Every day I get to help a different industry, organization, or even country tackle their specific geospatial conundrums.   

What types of geographic questions do you ask and think about in your work? 

I deal with every type of individual, organization, or entity that completes geospatial field data collection. The amount of technology and science that we work with and integrate is expansive. If you don’t have good geospatial data, you won’t complete good work. Thus, I ensure my customers can collect amazing, authoritative data so that they can perform their downstream tasks more efficiently and confidently. I may not get all the glory for completing these projects, but that is not important. What is important is being able to collect good data!  

What types of data did you acquire to support your work?  

Our GPS devices natively collect latitudinal, longitudinal, and elevational values, along with geodetic metadata associated with the acquisition of the spatial coordinates. Additionally, our devices are integrated into utility locators, which detect underground systems of infrastructure; laser rangefinders that help collect offset locations like tree heights; and most drones/LiDAR systems which collect remotely sense data like aerial imagery, point clouds, radiation, and non-visible light spectrums, and temperature.  

What types of knowledge and skills, both geographic and general, do you use to evaluate, process, and analyze the data you gather for your work? 

Mostly GIS software packages like Esri ArcGIS Pro or Q-GIS are used to evaluate the data procured by the Bad Elf devices. Additionally CAD programs like AutoCAD Civil 3D and BIM programs like Revit are used for modeling purposes. Additionally, we use computer programing languages like Python to manipulate the data.  

How do you communicate the results of your work? Do you have a recent product or publication to share with us as an example?  

We mostly make quantitative maps and spreadsheets showing our data and how they compare to other datasets. Our clients use hundreds of different methods and applications to complete this process. A perfect example of a customer using Bad Elf, Esri, Go Pro Cameras, tablets, and e-bikes to collect utility data is this case study from the town of Cave Creek, Ariz. 

How do you view your work in relation to civic engagement and issues that you care about?  

I engage daily with both the private and public sectors of our society so that they can better complete the tasks they set out to do. I eat, sleep, and dream geospatial. Every day that I get to engage in helping people do better spatial tasks is a great day.  

How does your career align with your values and aspirations in life now and back when you were a student?  

I feel very blessed because my employer and my values align extremely well. Aligning well with your organization is extremely important for your happiness and growth, but also for the organization to be successful. My father always said, “Nik you will eat a lot in your life, so enjoy your food. You will also sleep a lot, so enjoy your bed. Lastly you will work the most, so make sure you love your job!”  


This material is based upon work supported by the National Science Foundation under Grants No. 2031418, 2031407, and 2031380 (Collaborative Research: Encoding Geography – Scaling up an RPP to achieve inclusive geocomputational education). Any opinions, findings, and conclusions or recommendations expressed in this material are those of the author(s) and do not necessarily reflect the views of the National Science Foundation 


    Share