The State of Geography: Patterns and Trends by Racial and Ethnic Identity
In December, AAG released the State of Geography report, which provides an overview of broad trends in degree conferral at the undergraduate and graduate levels, both within geography and in comparison with general trends in other social sciences and in academia overall.
Last month, we examined the data for trends and indicators in terms of gender identity. This month, we look at how well graduation trends are doing in terms of representation of students across racial and ethnic groups that have been historically excluded from geography.
As President Marilyn Raphael noted in her February 2023 President’s column, “The [State of Geography] report confirms some of the concerns about our field’s lack of diversity, offers signs of change, and leaves us with important questions about the nature and constraints of the data,” which is drawn from the National Center for Education Statistics, Classification of Instructional Programs (CIP) codes.
In the report and this article, AAG is using the term “historically excluded populations” to designate the students in these categories. American Indian or Alaska Native, Asian, Black or African American, Hispanic or Latinx, Native Hawaiian or Other Pacific Islander, Student Visa Holder, Race/Ethnicity unknown, and Two or More Races. We also used the term to follow the practice of AAG’s JEDI committee, which uses the term intersectionally, acknowledging that multiple modes of discrimination can combine (e.g. racism, sexism, ableism, classism), and describing the persistent barriers of the discipline, be they formal or perceived:
“Geography is not perceived as a welcoming discipline for women, queer and trans people, oppressed racial/ethnic groups, and other individuals from historically excluded populations. There are several interconnected reasons for this. First, modern geography’s roots in white, Western, patriarchal, settler colonial, and cis-heteronormative understandings of the world mean that the discipline has long reflected and perpetuated systems of oppression. Second, there are systematic and structural barriers that limit the recruitment and retention of diverse faculty and students. Third, marginalized faculty and students do not necessarily see geography as relevant or reflective of their realities, and as a result, they do not see in it prospects for a well-defined, practical, and impactful career. Together, these elements create impressions of geography that range from antiquated to hostile. While these perceptions exist today, they should not mark geography’s future. Receptivity will only improve if we become intentional about embedding JEDI into standard practices within the AAG and the broader geography discipline.” [Source: AAG 3-Year Justice Equity, Diversity, and Inclusion Plan, 2021]
The State of Geography report is among AAG’s efforts to embed JEDI into standard practices within our organization and to encourage their adoption throughout the discipline.
Signs of Promise
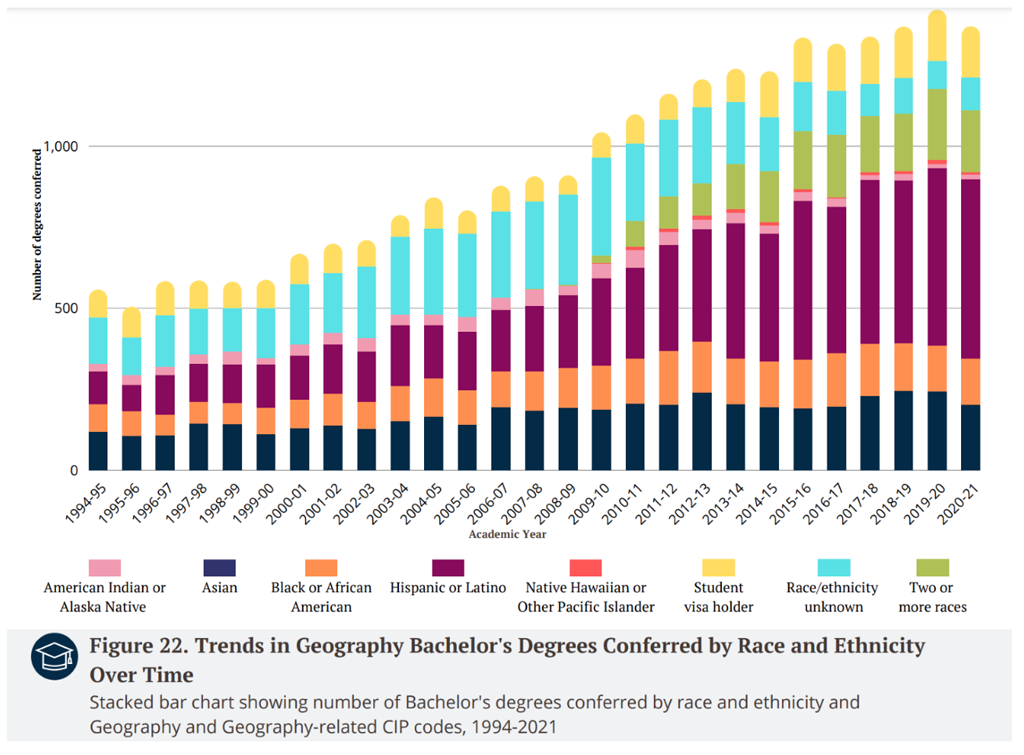
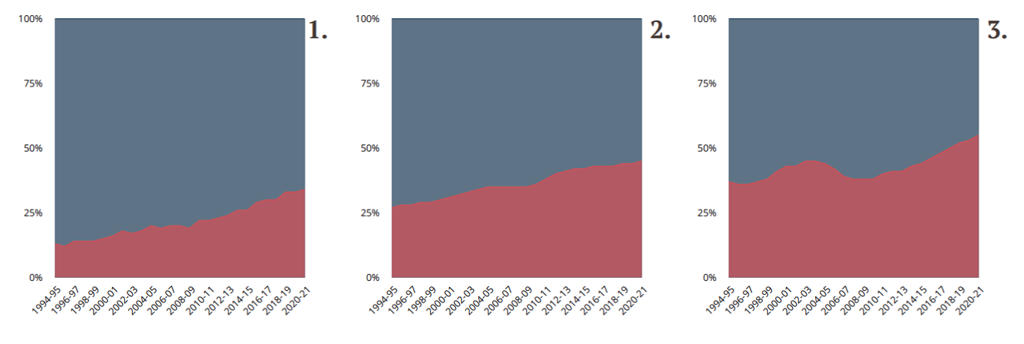
Even as growth in overall degree conferrals has dropped in geography for roughly the past decade, the graduation rate of students in historically excluded populations has grown during the same time. In fact, during the past 25 years, the percentage of degree-earning geography students who are from historically excluded populations has more than doubled, from 14.8% in 1994-1995 to 36.4% in 2020-2021. The trend is most pronounced in graduate studies, particularly PhD programs. Our analysis included student visa holders among the categories because NCES counts them among the race and ethnicity categories they track. This group of students makes up a large proportion of students at the graduate levels, and themselves form a diverse cohort of many racialized identities within and beyond an American context, although it is hard to identify specific racial or ethnic groups in this category.
At the bachelor’s degree level, the proportion of students in many racial or ethnic categories increased, with the greatest gains among students of more than one race and Latinx or Hispanic students. There was little growth in bachelor’s degree conferral among American Indian and Alaska Native students or Black/African American students.
In fact, there appears to be almost no growth in bachelor’s degree conferrals for Black students since 2010. Given total growth, the percentage appears to be declining for percent growth of Black students, a phenomenon that adversely affects the number of Black PhD graduates and, consequently, Black geography faculty.
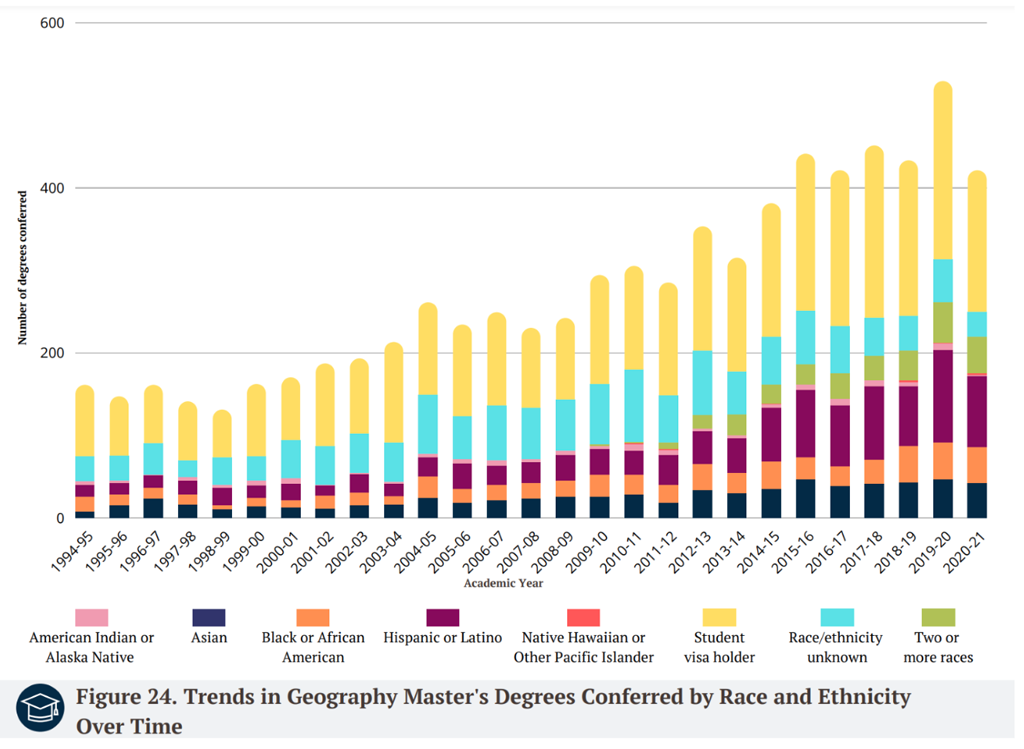
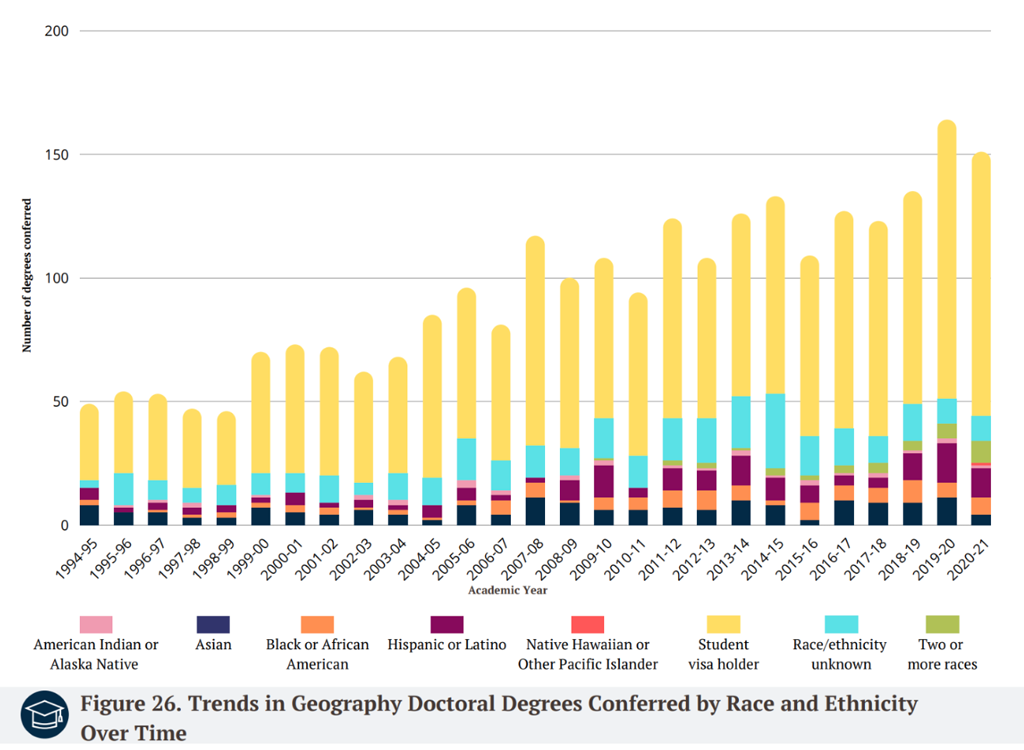
At the master’s and doctoral levels, U.S.-based diversity drops dramatically, while student visa holders become a significant proportion of degree recipients. The increase in student visa holders, proportional to other student groups, during the past decade suggests that international students–who often have quite different understandings and experiences of race—may be more attracted and welcomed to U.S. geography than U.S. students of color.
There appears to be an inverse correlation between the level of degree and the diversity of the students pursuing the degree. Diversity is greatest at the undergraduate level, drops at the master’s level, and drops still further at the doctoral level.
How Geography Compares Among Disciplines
Because geography is an interdisciplinary science, we compared student choices of major among several social science and physical science disciplines. As a graduate degree sought out by students from historically excluded populations, geography holds its own among the social sciences at the master’s level, with slightly better representation at the PhD level than most other social sciences (with the exception of economics). At the bachelor’s level, however, geography has a lower rate of representation among these students than most other social sciences, except for history.
Geography fares similarly to other physical sciences in the amount of representation from historically excluded groups in bachelor’s degrees, master’s degrees, and PhDs. Representation increases from bachelor’s to master’s to PhD.
Overall, geography is behind virtually all other fields of study we examined across all degree types, in terms of racial and ethnic representation. From 1997 to 2019, Jordan et al. (2021) found that “geography [doctorates] consistently trailed the social sciences and the academy,” a gap that has been widening. More than half of computer science degrees, to cite one example, are conferred on students from minoritized backgrounds—across all levels of degree. This indicator has relevance for GIS studies within geography: computer science and data analysis, perhaps data visualization, are a popular degree for students of many backgrounds, and GIS programs can leverage this popularity, combined with greater efforts to attract and retain students from diverse backgrounds.
Concluding Thoughts
The growth in geography degrees among students from historically excluded populations is good news for the discipline: it is they who have contributed any new, positive growth to the field in recent years. That growth is nowhere near the levels needed for full, representative equity, however. While it offers a signpost to a more diverse geography, the overall lack of diversity is also a reminder that we must redouble our efforts.
In developing the report, we encountered several unknowns, such as the “race/ethnicity unknown” category and the student visa category. As noted in our article on gender, qualitative information is also not available. Gaining qualitative insight is crucial because an increase in graduates from groups previously excluded does not mean that racial bias and inequality do not exist. Jordan et al. (2021) identify four drivers of inequity in doctorate programs:
- lack of dedicated funding for underrepresented minority doctoral students,
- minimal prior exposure to academic and professional geography,
- passive recruitment strategies, and
- pervasive whiteness of departments.
In her 2002 article “Reflections on a White Discipline,” geographer Laura Pulido looks at her own experience as a student and faculty member of color within geography programs. Finding that “the study of race is both marginalized and fragmented within geography,” she ultimately moved from geography into a newly organized American studies program that acknowledged ethnicity and race. She writes, “Although other issues also existed, comfort and intellectual community were the key reasons I made the move.” These studies indicate that pragmatic factors such as funding and active recruitment should be coupled with a strong commitment and follow-through for the representation of many identities, and a welcoming and supportive intellectual environment for engaging critical questions around race, ethnicity, and identity.
As we previously noted in our article on gender identity and degree conferral, NCES data do not lend themselves to being examined intersectionally, that is, with an acknowledgment of the complex ways discrimination and marginalization can function across multiple identities. Separating out race and ethnicity from gender cannot be done: we are all a combination of various identities and experience our lives through the lenses of those identities, including our experience of exclusion. Quoting the JEDI Committee once again, “…there are systematic and structural barriers that limit the recruitment and retention of diverse faculty and students [and] marginalized faculty and students do not necessarily see geography as relevant or reflective of their realities, and as a result, they do not see in it prospects for a well-defined, practical, and impactful career.” Although the numbers indicate that more students of differing identities are finding their way to geography, especially for advanced degrees, we must find ways to build on this positive trend: to actively working toward structural change in the discipline and to find out more about what attracts students of differing identities and experiences to geography, and what contributes to their decision to pursue advanced study.
Get Involved in the Next State of Geography Report:
We look forward to further expanding on our findings in the State of Geography Report in the future, with data from a variety of sources, including NCES, AAG surveys, and AAG member expertise. We welcome questions, ideas, or suggestions about the findings at [email protected].
Read the full reportFurther Reading
Peake, L.J. & England, Kim (2020). (What Geographers Should Know About) The State of U.S. and Canadian Academic Professional Associations’ Engagement with Mental Health Practices and Policies, The Professional Geographer, 72:1, 37-53, DOI: 10.1080/00330124.2019.1611455
Brinegar, S.J. (2001). Female Representation in the Discipline of Geography, Journal of Geography in Higher Education, 25:3, 311-320, DOI: 10.1080/03098260120084395
Kinkaid, E. & Fritzsche, L. (2022). The Stories We Tell: Challenging Exclusionary Histories of Geography in U.S. Graduate Curriculum, Annals of the American Association of Geographers, 112:8, 2469-2485, DOI: 10.1080/24694452.2022.2072805

