Disrespect for the Rule of Law Undermines Science and Fundamental Social Norms

A world and society ruled through suppression and intimidation is fundamentally incompatible with academic pursuits, both in terms of science-informed policy and the social environment needed for good science. While scholarship ranges from basic to applied, and from deeply critical to more constructive, an explicit end goal, or positive byproduct, is often rules and regulations that are informed by a solid understanding of the world. The academy also does not do well when findings are distorted by politics, or the free flow of ideas and people across borders is impeded. A thriving geography depends on the rule of law at home, and strong norms and multilateral institutions internationally.
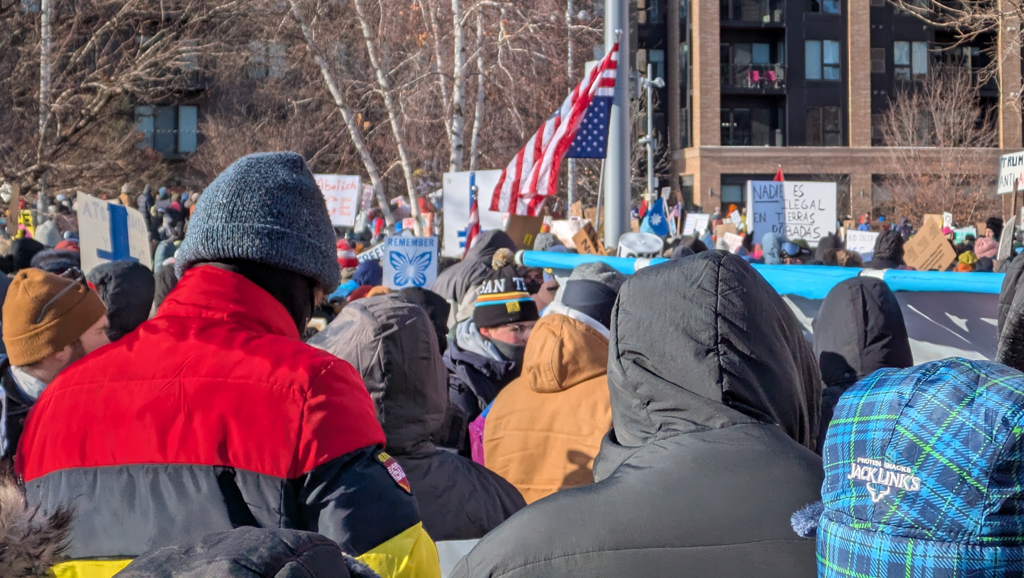
The current U.S. administration’s “might makes right” approach to domestic and international politics cannot coexist with or support a thriving academy and discipline of geography. How can it, when it undermines the very basic tenets of society? Daily life in my hometown of Minneapolis-Saint Paul has been deeply disrupted by the presence of 2,000-plus federal Immigrations and Customs Enforcement (ICE) agents in recent weeks. Renee Nicole Good and Alex Jeffrey Pretti were murdered in broad daylight for practicing legitimate and constitutionally protected passive resistance, high school students have been tear-gassed when leaving schools, child day care centers have become targets of aggressive military tactics, and people of color (including Native Americans ironically) have been consistently harassed and detained, regardless of their citizenship status. Among a myriad of other impacts, education is being disrupted, local schools have shifted to online learning, and foreign-born faculty and students at local universities and colleges (including my geography department) are understandably afraid and concerned. This is not okay. A federal security force has been weaponized against a particular geography (a state and city it deems a political enemy), the rule of law is not being respected, and ICE agents feel like foreign occupying forces who have no understanding of good community policing.
The administration’s coercive tactics in Minnesota are mirrored in their approach to international affairs (i.e., they are two sides of the same coin). On January 3, 2026, the U.S. President unleashed a dangerous genie when he authorized a mission to capture Venezuelan president Nicolás Maduro in Caracas, Venezuela, violating international law and another country’s territorial sovereignty. This attack signals a return to a 19th century multipolar world where great powers do as they please in their own backyards. While I am not naïve enough to believe that late 20th century multilateralism was perfect, at least there was a promise of strong international institutions, the rule of law, and fact-based policymaking. Geographers of all stripes, and from around the world, have made key contributions in studying the problems of our colonial past and foreign adventurism, as well the strengths and weaknesses of post WWII multilateralism and science-based policymaking. While I am clearly an idealist as opposed to a realist (in international relations terms), I believe geographers have an interest in promoting global cooperation and respect for human rights and international law.
Whatever you may think of Nicolás Maduro, the U.S. violated international law, and another country’s territorial sovereignty, when it sent troops into Caracas to capture him. Worse yet, these actions essentially give other military powers a green light to exact their wills on their neighbors, be it China in Taiwan or Russia in Ukraine. We have been here before and it does not end well. While the U.S. was not a formal colonial power like its European counterparts, its own territorial expansion, and 19th/20th century foreign adventurism, essentially constituted a U.S. imperial era. The atrocities of 20th century wars created a space for multilateralism, the rise of international institutions like the United Nations, the forging of international agreements on basic human rights, and scientific commissions on climate change, food security, and natural disaster mitigation. These hard-fought gains for a more peaceful, humane and sustainable world, in which many geographers played a critical role, must not be relinquished.
The atrocities of 20th century wars created a space for multilateralism, the rise of international institutions like the United Nations, the forging of international agreements on basic human rights, and scientific commissions on climate change, food security, and natural disaster mitigation. These hard-fought gains for a more peaceful, humane and sustainable world, in which many geographers played a critical role, must not be relinquished.
The aggression of the U.S. against its own citizens and residents, as well as the emerging multi-polar world being cemented by recent U.S. actions, are bad for science for at least two reasons. First, authoritarian politics contort scholarly priorities, emphasizing some areas (defense, surveillance and control) and downplaying others (healthy critique of government programs and actions, examination of troublesome histories, self-reflection on colonial assumptions in our disciplines). Second, the fear-based and isolationist tactics of authoritarianism undermine the international institutions that develop science-based policies and facilitate scientific collaboration and exchange.
Mapping the Path Forward
At some point, this moment will pass, and we will be faced with creating a post-Trump world. In the U.S., basic civic education and an appreciation for the rule of law are fundamental to a well-functioning society. While Trump has done much to weaken democratic norms, the vocational drift in U.S. education arguably contributed to the problem with a decline in the development of critical thinking skills and civic engagement. The growing economic divide in the U.S., brought on by neoliberalism, also did much to undermine public trust in higher education and research. In addition to important governance reforms to address campaign finance and the overreach of executive power, we need to address underlying structural problems (eroding public support for democracy and declining access to education) and think big about opening up quality K-12 and higher education in the U.S. to all income groups if we are to have a durable democracy.
On the international stage, multilateralism is clearly not dead, but it has been ailing for some time and the Trump Administration’s actions have wounded it further. Strong international institutions and norms are an antidote to a multipolar world that is a danger to science. While I acknowledge that the United Nations is in need of serious reform, something like it must persist and evolve into a more robust and participatory global forum which supports fundamental rights and brokers international agreements on the environment, health, nutrition and peace-building to name a few. Despite domestic political pressures, geographers must avoid nationalist traps and continue to engage with and support international institutions and exchange.
I don’t like bullies, I never have. It is hard to be thoughtful and productive when you are concerned about your own safety. Furthermore, it is challenging to have a generative scholarly exchange when people are concerned about political censorship or repression. In order to better the human condition and build a more sustainable world, we need strong democratic norms and institutions at home and abroad, i.e., civic nationalism and internationalism.
Please note: The ideas expressed in the AAG President’s column are not necessarily the views of the AAG as a whole. This column is traditionally a space in which the president may talk about their views or focus during their tenure as president of AAG, or spotlight their areas of professional work. Please feel free to email the president directly at moseley@macalester.edu to enable a constructive discussion.


 This is the sixth of a short series of perspectives by 2024-2026 Council Treasurer Antoinette WinklerPrins — a series designed to help illuminate some of the financial challenges a professional organization such as the AAG faces. In this column, she offers perspectives on the financial aspects of running the AAG Annual Meeting.