The geographer who loved nothing more than exploring unfamiliar territory has embarked on his next journey, to a destination not found in any atlas. William Ganfield Laatsch, 84, passed away September 14, 2022.
William Laatsch was born June 20, 1938, in Waukesha, WI, to Wayland and Elizabeth (Ganfield) Laatsch. His lifelong love of learning and exploring began in childhood, nurtured by family trips to Northern Wisconsin and the east coast. An only child, he often joked about how, instead of being chaotic and crowded affairs, holidays were often spent reading, surrounded by aunts and uncles who would do the same until cocktail hour.
I don’t expect them all to become geographers. I just expect them to be better stewards of the Earth and its people.
While Bill’s immediate family was small, his youth in Waukesha was surrounded by a close knit group of families that included Richard and Elizabeth Hunter and their daughter Frances. Growing up on the same block, Fran and Bill would accompany each other to school which was the start of a loving relationship that would see them marry on August 18, 1962 and go on to spend the next 60 years together. Fran was Bill’s partner as he pursued his academic career, and together they traveled widely, across North America, Europe, and Asia. They had a special affinity for the American West. Together Bill and Fran would raise two children, Ann (Shorewood, WI) and David (Wauwatosa, WI).
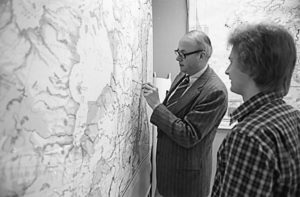
In 1956 Bill enrolled at Carroll College, now Carroll University, where his family ties to the institution ran deep. His grandfather, William Arthur Ganfield, served as the College’s sixth president and Bill’s parents, aunts, and uncle also attended Carroll. He continued his studies at the University of Oklahoma where he earned a Master of Science in physical geography, and the University of Alberta in Edmonton. There, he studied high latitude geography, mining development, and town site development. (Decades later, he would be honored with a Yukon ecological reserve named after him in recognition of his 1970’s doctoral dissertation recommendation that the region emphasize ecotourism as a hedge against the decline of mining). After earning his Ph.D. in cultural geography, he accepted a position in the Department of Regional Analysis at the University of Wisconsin-Green Bay.
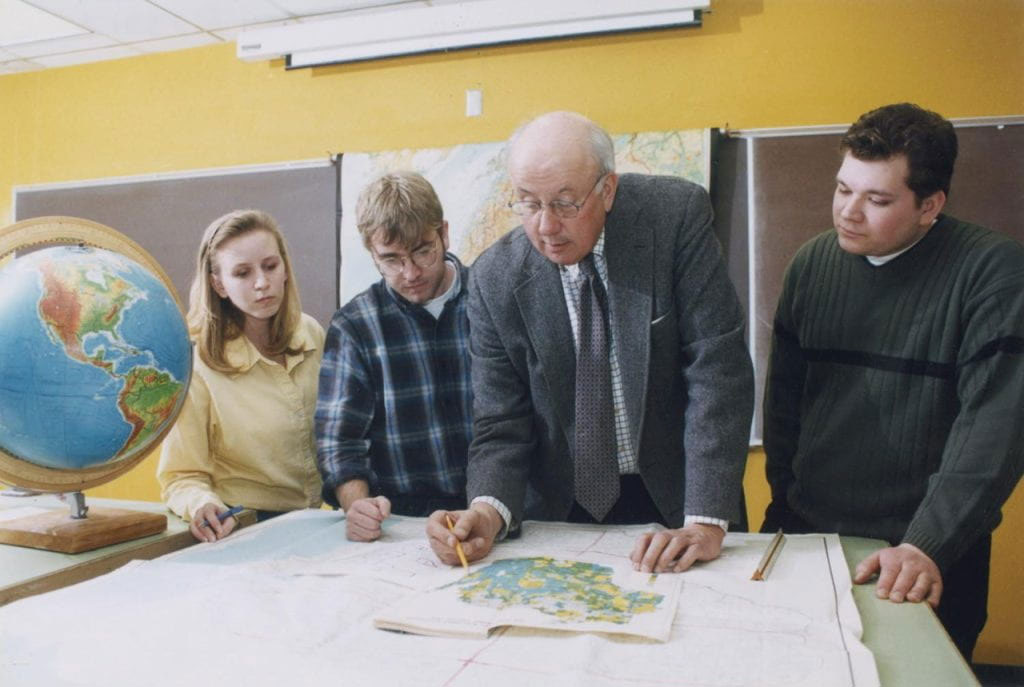
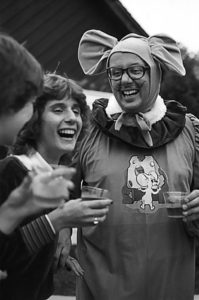 Bill spent 43 years at UWGB as a Professor of Geography and Department Chair, and postponed retirement to fill the position of Interim Provost and Vice Chancellor for Academic Affairs. For decades, he hosted the Bill Laatsch Wine and Cheese Classic each fall, where he—dressed as a 6’4” gray mouse (shown at right)—would welcome students back to campus with his signature warmth and good humor. Bill retired in 2009, and became the first faculty member to have a classroom named in their honor. During the course of his career he earned numerous prestigious awards for teaching excellence, both locally and nationally. Bill inspired generations of students to pursue careers in teaching, urban planning, cartography, GIS, remote sensing, and other professions related to cultural geography’s focus on the Earth and how humans interact with it. About his students, he remarked “I don’t expect them all to become geographers. I just expect them to be better stewards of the Earth and its people.”
He also served as a consultant for the U.S. Department of Defense, Wisconsin Department of Transportation and the Wisconsin Department of Development. He was a member of the Editorial Board of the “Voyageur” Historical Review, former chairman of the State of Wisconsin Historic Preservation Review Board, Chairman of the Midwest division of the Association of American Geographers and Fellow of the American Geographical Society. He is a former President of the Heritage Hill Corporation, which operates the Heritage Hill State Historical Park for the Department of Natural Resources.
 A professional interest in Belgian settlement in northeastern Wisconsin culminated in helping to establish the Belgian Heritage Center in Namur, Wisconsin, which is dedicated to telling the story of Belgian settlement in Wisconsin and works to preserve unique elements of Belgian culture. Bill loved leading bus tours of the Southern Door County Belgian architectural and historical sites for students, tourists, and anyone who would seek out his expertise and, to his children’s horror, terrible jokes.
A deep allegiance to his alma mater, Carroll, is evident in Bill’s years of service to the institution. He served on the Board of Trustees for 19 years (1991-2010) chairing numerous committees and ultimately as Chairman of the Board.
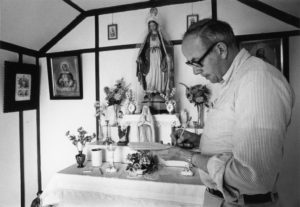
Bill revered the Earth’s beauty, and was moved to tears when he saw Mount Everest in person in 1996. He loved Jake’s corned beef, deep belly laughs, early morning fresh cheese curd runs, Door County, and striking up conversations with strangers across the world (whether they spoke his language or not). A champion trapshooter, he loved shooting and found joy in teaching his children to enjoy the sport as well. Above all else, he loved being Papa to his grandchildren. He treated everyone he met with respect and kindness, and gave generously of his time and energy to environmental, educational, historical, and artistic causes.
Bill was preceded in death by his parents and his beloved in-laws Richard and Elizabeth Hunter. He is survived by his wife Frances Hunter, daughter Ann Laatsch, son David (Tara) Laatsch, and his two amazing grandchildren, Elizabeth and Andrew, as well as countless friends, colleagues, and students who he inspired, encouraged, and mentored.
Reprinted with permission from the Feerick Funeral Home.
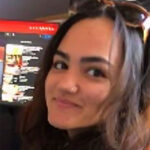 Iman Smith is a junior at the University of Maryland, pursuing a B.S. in Geographical Sciences and a minor in Geographic Information Systems. Her areas of interest include agricultural monitoring and crop management, and global food security. In her spare time, Iman likes to travel, crochet, make pottery, and she also hosts a college radio show.
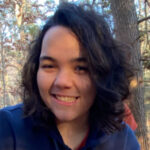 Allison Rivera is a senior at the University of Connecticut pursuing a B.S. in Geoscience and a minor in Geography. She is mostly interested in geomorphology and physical geography and is currently completing a senior thesis on such topics. After graduation, Allison hopes to attend graduate school and pursue further research in the field of geomorphology. In her spare time, she enjoys watching cartoons, going for walks, and reading.
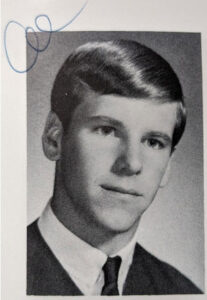
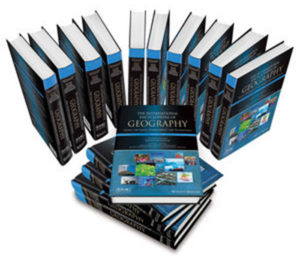 Representing the definitive reference work for this broad and dynamic field, The International Encyclopedia of Geography: People, the Earth, Environment, and Technology arises from an unprecedented collaboration between Wiley and the American Association of Geographers (AAG) to review and define the concepts, research, and techniques in geography and interrelated fields. Available as an online resource and as a 15-volume full-color print set, the Encyclopedia assembles a truly global group of scholars for a comprehensive, authoritative overview of geography around the world.