Member Profile: Dydia DeLyser
 “Figuring out what places are about” is the foundation of Dydia DeLyser’s inquisitive, hands-on work to explore and preserve American landscapes and cultural histories. A professor of geography emerita at Cal State Fullerton, DeLyser has cultivated this outlook from early on. As the child of Dutch immigrants who came to the U.S. in the 1960s, she learned early how place, belonging, and language could open—or close—doors.
“My first language is not English, it was Dutch,” she says. “So my earliest memories are of having sort of a secret language at home that nobody else could understand.” Her parents were “always trying to understand American culture, and yet never able to become a part [of it].”
For DeLyser, the outsider status was doubled by another kind of “outside:” the past. Her parents’ vivid stories of their experiences of World War II and the privations of life in Europe even before Nazi occupation lit up DeLyser’s imagination and appreciation for social history: “The broader cultural stories about our past, like my parents’ stories about the war, are also intimate personal stories that happen in the lives of individuals,” she says. “We connect our individual experiences to the broader narrative, you know, of victory over the Nazis or so many other issues. That’s a geographical or spatial experience.”
DeLyser’s hunger to understand and embrace places and times she couldn’t know firsthand have led to her foundational preoccupation with what she calls “the intimate geographies of social memory.”
Bridging Time and Space
DeLyser started working on her intertwined study of history’s large scales and intimate personal histories while she was still an undergraduate at UCLA, aided by her work at UCLA Library’s Department of Special Collections in the manuscript, photographs, and rare books library, one of the largest such departments in the country. The archive housed the personal papers of L.A. notables and international figures such as novelist Raymond Chandler, journalist Carey McWilliams, writers Henry Miller and Anaïs Nin, and Peggy Hamilton, the first fashion editor of the LA Times.
Reading their letters and manuscripts opened DeLyser’s eyes to new ways of knowing people, even after their deaths. Research—specifically, qualitative research with primary materials—was like a portal through the gap in time and place that had so fascinated and frustrated DeLyser from childhood. She has dedicated her career to the methods that make qualitative research vibrant.
“To me, scholarship should be empirically rich, grounded in some real thing,” she says. “It should be theoretically sophisticated and engaged with whatever conceptual conversations are current and engaging and relevant in the discipline or subdiscipline you are in, and it should be methodologically articulate.” Put simply, she says: “You should be clear how you know.”
DeLyser describes research methods as “an important form of credibility for a scholar, as the core of your scholarly credibility. If you can show how you know—because you interviewed these people or because these are the quotes or because you did this archival research or you spent ten years observing at this place or because you actually did the labor or whatever the reason—If you can show how you know, then we will trust you. And then we’ll be able to learn from you, we’ll be able to take on whatever your point is.”
If you can show how you know, then we will trust you.”
Early in her career, DeLyser established a close relationship to Bodie, a California ghost town in the Eastern Sierra region. Designated a National Historic Landmark and state park in the early1 960s, Bodie began as a gold-mining town that boomed in the 1870s, crashed in the 1880s, but then lingered well into the 20th century. As the population declined, at one point there were more buildings than people. And as residents left, they abandoned furnishings and things they didn’t want to pay to move, which became the intact artifacts of their daily lives on display in about 200 buildings, from dishes, pots, and chairs in kitchens to unused caskets in the town morgue.
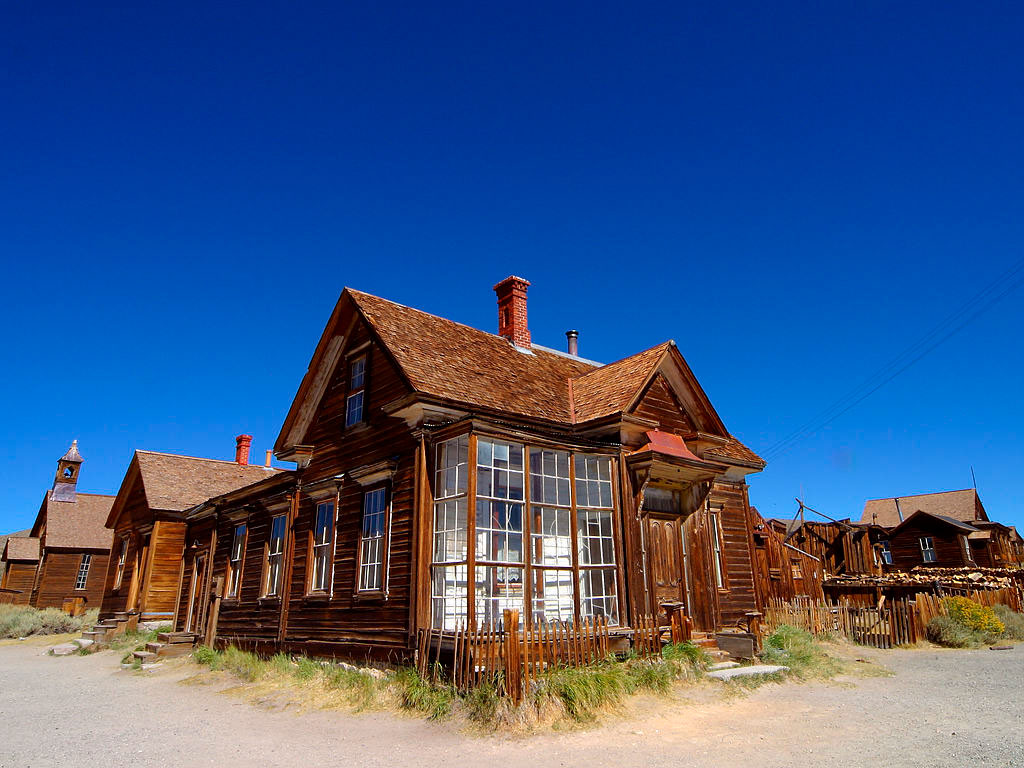
Starting when she was a college student with summers free, she began working as a low-paid, unskilled seasonal worker for maintenance, DeLyser gradually deepened her knowledge of Bodie over the next 35 years in all different ways, from conducting ethnographic research tourists there to using the Park’s own archive to understand how State Parks staff were themselves shaping what visitors saw and ultimately to using her research to make the case for broadening the town’s National Historic Landmark status, all while putting in true sweat equity in caring for the town, from physically working to stabilize the abandoned buildings to “cleaning about 10,000 [public] toilets.” Now, she is executive director of the town’s nonprofit, working to preserve Bodie in a state of “arrested decay—keeping the buildings standing while letting them look like they’re still falling down,” according to DeLyser. Today’s visitors to Bodie can peer inside its buildings to see the many personal items left behind by the final occupants, and imagine the lives of the town’s former inhabitants. DeLyser was interested in the impact of this on visitors, especially in the moments of recognition when a specific object reminded them of something in their own lives. DeLyser then sought to map these personal epiphanies onto the larger stories of history.
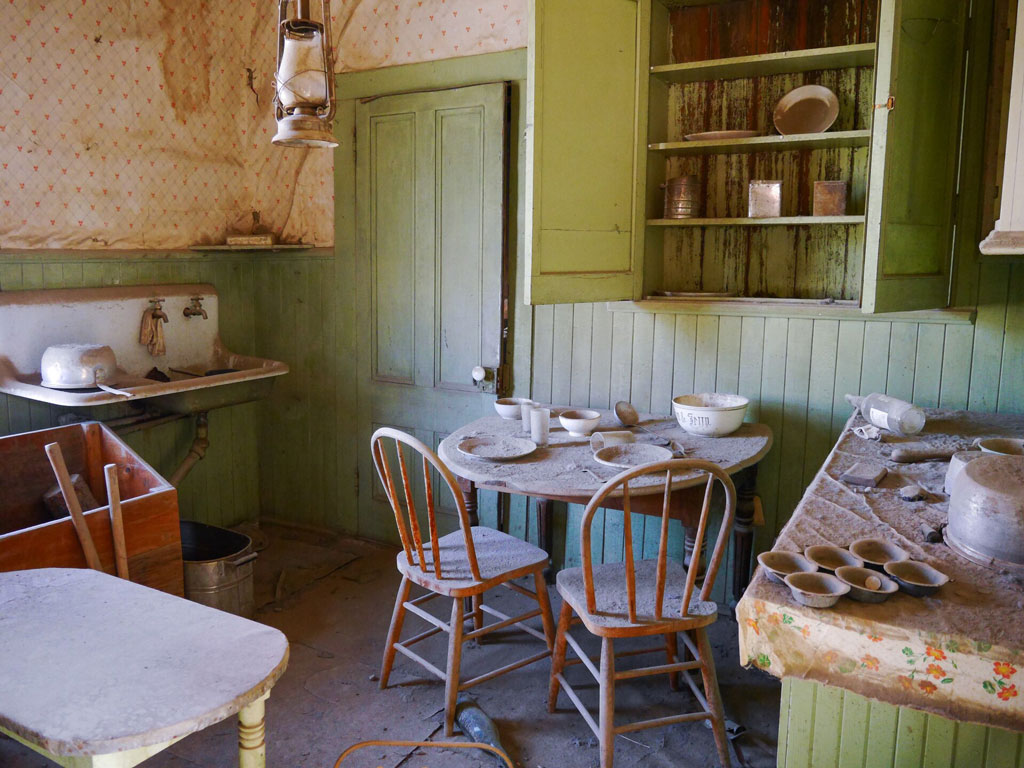
“Ghost towns are so connected to the mythic West in the United States, to the heroic, mythologized tales of the “Wild West” and all that, we simply connect ourselves to big themes about American culture. All of a sudden, from a small life and a small object, it links to the big themes. I’ve seen myself have ordinary objects spark magic in my life many times, and I’ve studied how it happens.“
Always say yes
DeLyser also engages enthusiastically as a teacher, mentor, and champion of the geography discipline. Over the years, she has served on AAG Council, was a founding member of the AAG Qualitative Research Specialty Group, contributed to the work of the AAG Harassment Free Task Force, as well as its Public and Engaged Scholarship Task Force. She worked tirelessly during the COVID pandemic to deliver supportive programming for graduate students, and also serves on the AAG Climate Committee, to name only a few contributions. It’s part of her commitment to hold the door open for the next generation of geographers.
“I’ve had to bust open doors myself in my career, but the point isn’t about busting open doors. The point is to hold the door open and create a pathway for success for the people who will come after us,” she says.
She brings the same esprit de corps to her research and publishing. “There’s no sense in scholarship unless it’s shared,” she says. “If I can learn something from my scholarship about the past, I feel obligated to share that, otherwise I take it with me. It happens in the moment, it happens in the present, but it’s always for the future.”
Living in Bodie, where only Park staff now live, gave DeLyser a strong sense of community, and a strong desire to give back to that community, something that has followed her throughout her career.
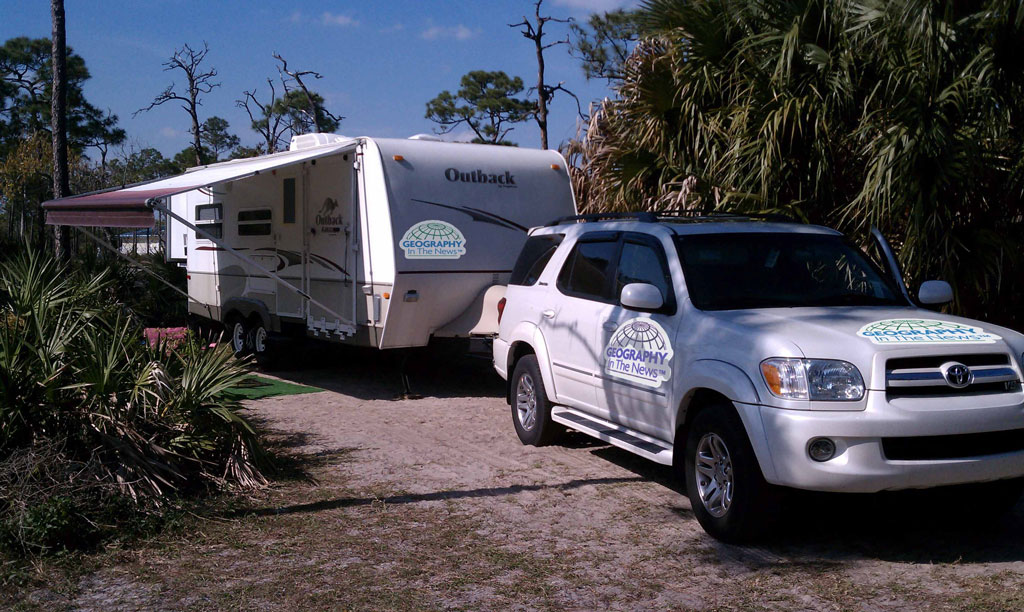
DeLyser is careful to appreciate and credit the communities she works with. Years later, as she launched a new research project about how neon signs have shaped the American landscape she recognized that there was a “neon community” or “communities” in the U.S., and, she says, “I wanted people to feel like they knew who I was and they welcomed my work, so it took me a long time to become part of that community, vested in being part of a community as ‘neon people.’” DeLyser says neon signs are “an incredibly overlooked part of the American landscape. People read the sign that says “OPEN” over the door that’s red and blue—they read that sign without even realizing that they’ve read it.” She wanted to bring those hidden signs and their hidden stories to light.
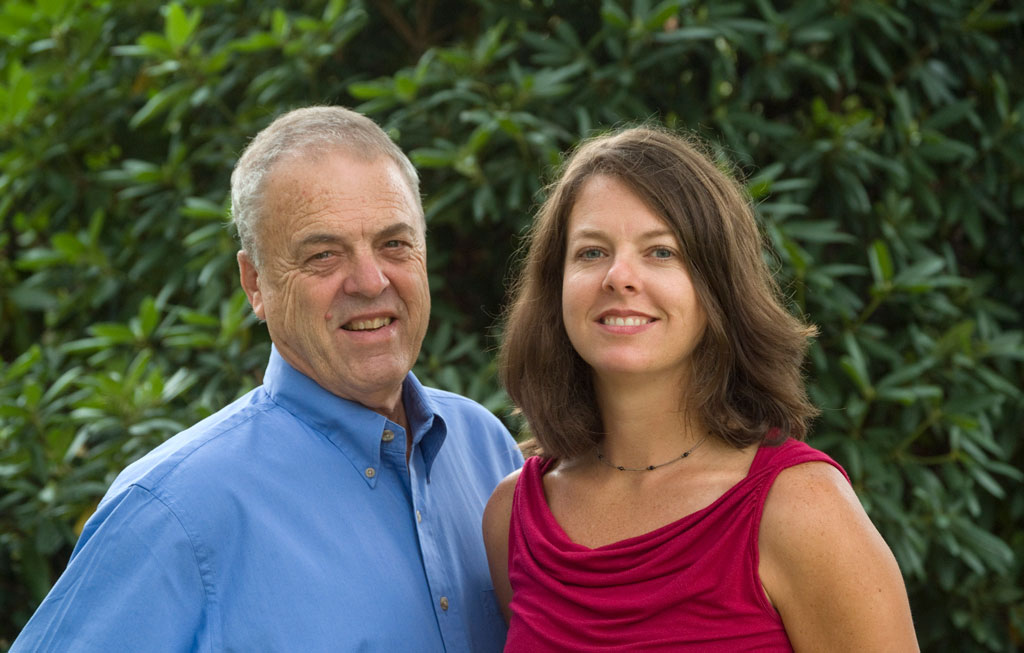
DeLyser had been introduced to the behind-the-scenes world of neon by her husband and longtime creative partner, Paul Greenstein, an expert in the history and repair of classic neon signs. Early in their relationship, she accompanied him to repair a sign over a restaurant, and the adventure sparked questions and conversations, which in turn led to more than a half dozen collaborations over the years. Greenstein and DeLyser have delved into the history and cultural significance of neon, antique cars, and Indian motorcycles. Their 2021 book Neon: A Light History is the latest culmination of these collaborations.
DeLyser’s approach to research combines immersion in the topic, becoming embedded in the communities that hold deep knowledge about it. She sees her research across a spectrum of often deeply personal and committed hands-on experience and careful methodologies. “I had all the tools,” she recalls of her long relationship with Bodie. “I knew how to use a hammer and a Skilsaw, and I also I knew how to do an interview. I had a hammer in one hand and a notebook in my pocket.”
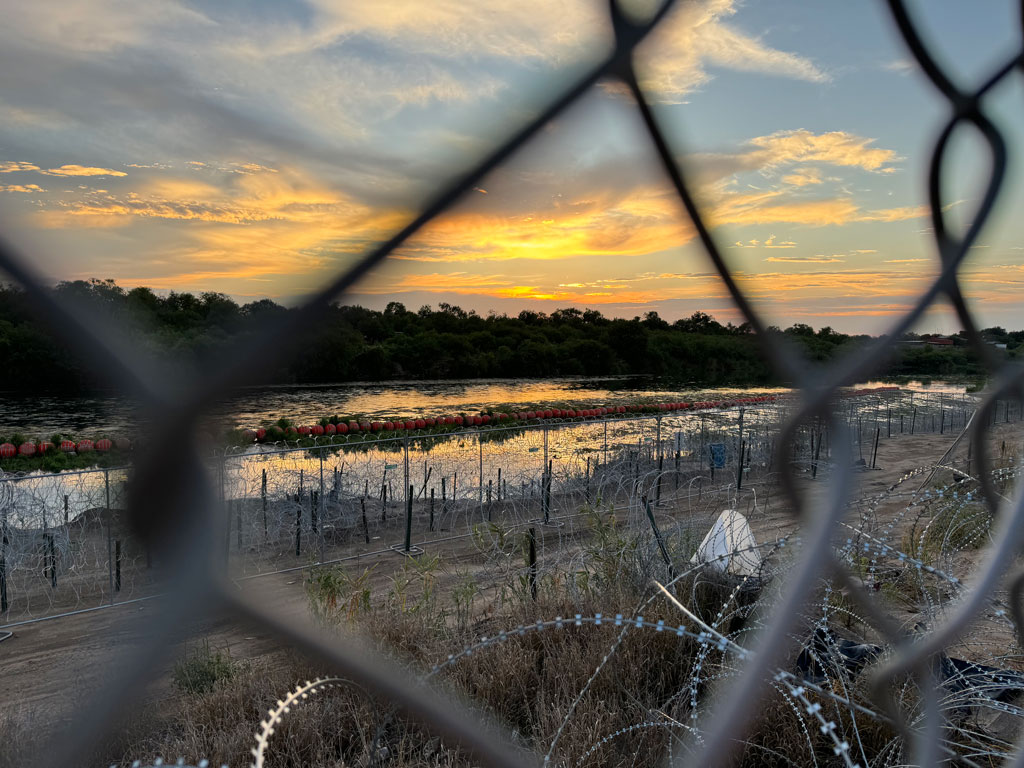
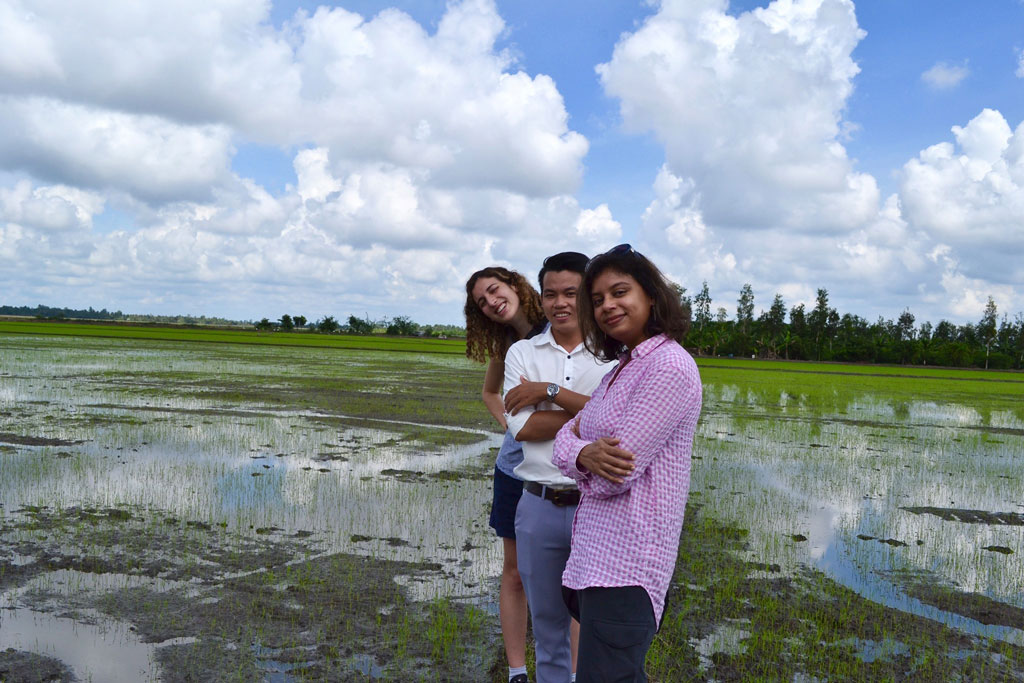
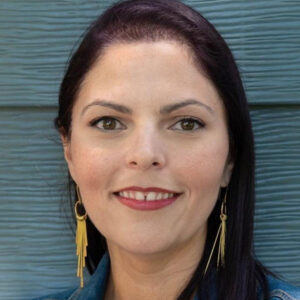 Adriana (Didi) Martinez knows that the only thing more important than scientific understanding is the ability to share and act on that understanding with a community. As a physical geographer who studies the dynamics of rivers—a fluvial geomorphologist, to be precise—she is trained to find out what helps rivers flow and how human forces can help or harm them. In recent years, studying one of North America’s most beautiful and embattled rivers—the Rio Grande—Martinez has worked to make sure her own knowledge flows, too.
 As a child, Pinki Mondal eagerly awaited her father’s arrival home from long trips around the world, working for one of India’s mercantile navy companies. Her earliest geography lessons came in special moments with him: “When he used to come back home, we would sit down with a map like an Atlas, and he would ask me, ‘give me a country name.’ And my job was to point that out on a map.”

 Mark Ortiz was almost finished with his bachelor’s degree at the University of Alabama, doing a self-designed major in environmental studies, when he realized that geography offered him the space to study nature and society in connection with one another. “I started reading work in critical geography and political ecology and felt that it was a natural fit where I could pursue the intersectional questions that interested me,” he says. He went on to earn his master’s and Ph.D. in geography from UNC-Chapel Hill.
 Kinkaid’s