Department Profile: School of the Environment at San Francisco State University
Located off the shores of Lake Merced in San Francisco’s southwestern corner, the School of the Environment at San Francisco State University (SFSU) brings together students and faculty committed to scientific exploration, environmental stewardship, and social justice. This unique setting, where urban life meets coastal and mountainous ecosystems, provides an ideal backdrop for studying the connections between people, landscapes, and the planet.
An Interdisciplinary Approach to Environmental Education
The School of the Environment offers a broad and integrated curriculum that reflects the shared mission of its faculty and programs. Students pursuing undergraduate majors gain a strong foundation in physical and human geography, in addition to field methods and geographic information science (GIS) and systems. These core skills equip students to understand environmental processes, helping them map change and analyze human–environment interactions. Graduate students have the option of specializing in geography, geographic information science, geosciences, or resource management and environmental planning.
These offerings are supported by the vast expertise of faculty across disciplines. Wide-ranging scholarly strengths range from physical geography and the use of technical programs to human-environment interactions. This includes food justice and urban agriculture, researching sustainable communities, green consumerism, and the politics of mobility.
A New School Built on Collaboration
In the years following the COVID-19 pandemic, the Dean brought together three units — the former Department of Geography and Environment, the Department of Earth and Climate Sciences, and the Environmental Studies program — to explore merging into a larger, more cohesive academic home. Andrew Oliphant, professor and School of the Environment co-director, shares the former schools’ shared curriculum, cross-listed classes, and overlapping student communities naturally evolved into what is now the School of the Environment, strengthening opportunities for interdisciplinary research, teaching, and collaboration.
With the formation of the new School, faculty intentionally centered equity, representation, and inclusivity in their mission. Their efforts include a range of initiatives: culturally responsive student support, reducing or eliminating course-related costs wherever possible, and expanding pathways into environmental careers for students from historically marginalized communities. As Oliphant notes: “One of our missions is to change the face of the professional world in California that’s managing and stewarding the environment.”
A Presence Across Campus and Beyond
While the School recently reorganized and renamed itself, department chair Andrew Oliphant notes that its reach extends far beyond environmental programs. Students from art, cinema, ethnic studies, biology, physics, and other departments enroll in its courses.
Through this broad academic footprint, students gain training in climate and environmental fundamentals and the necessary language and context for environmental advocacy. The skills taught in courses are applicable across scientific, creative, and civic fields.
A thriving student–alumni network speaks to the school’s deep commitment to mentorship and career support. Graduates contribute to the California workforce and beyond, including local and state governments, federal agencies such as the U.S. Environmental Protection Agency, and private companies and nonprofits such as East Bay Municipal Utility District (EBMUD). The school’s organically built internship network helps open doors for students who may not otherwise have access to such opportunities.
Preparing Students for a Changing World and Workforce
The school balances professional preparation with a deep commitment to the fundamental sciences. Students can begin to prepare for future steps to careers in environmental management, GIS, or planning; working with nonprofits in scientific research; or doctoral-level academic study.
Oliphant also emphasizes the importance of interdisciplinary training in an era of rapid technological change: “There will be geographers who lose work to AI … but the broad training we give — understanding biophysical processes, social structures, and the philosophies shaping our world — positions our students well in an AI-driven future.”
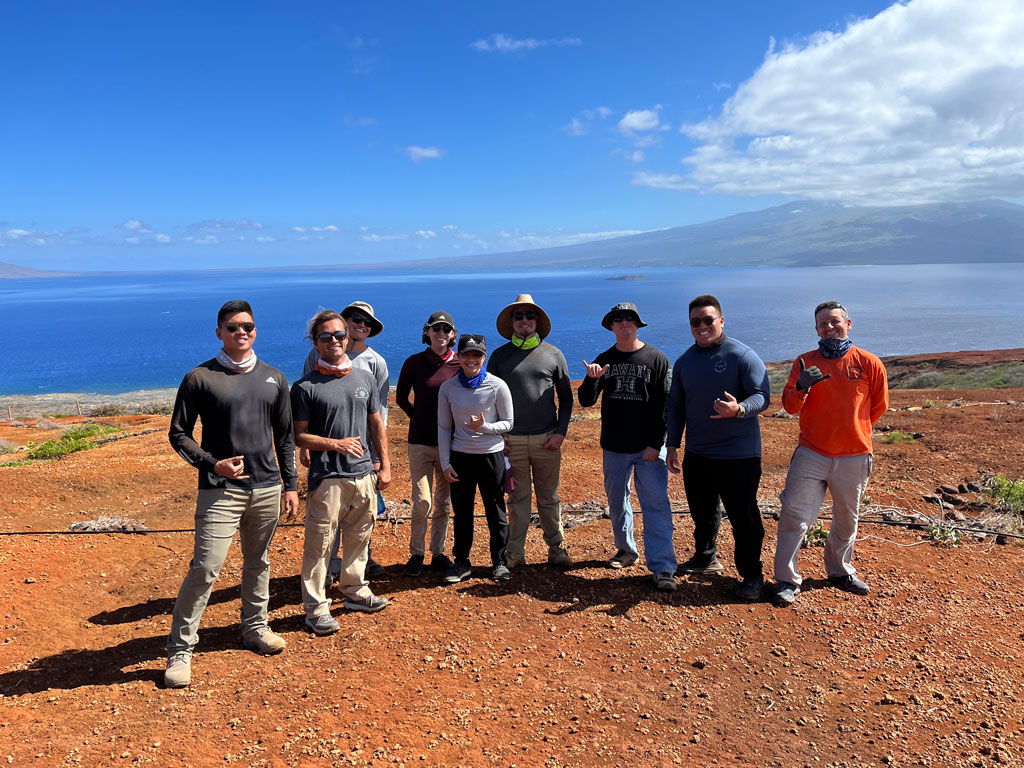
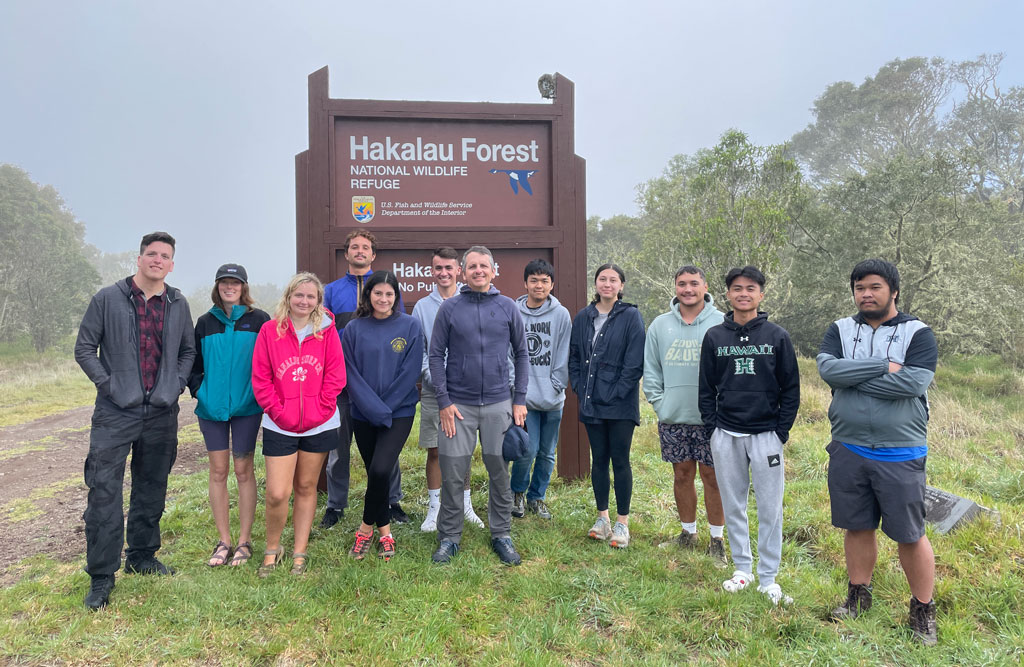
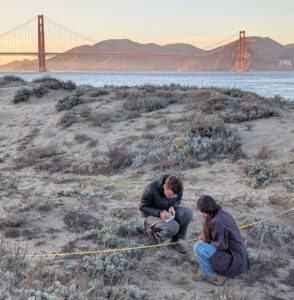
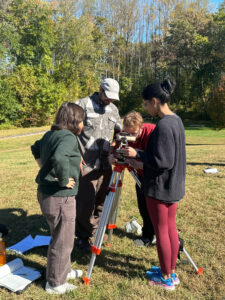
A prime resource for students includes participating in alternative learning spaces. For example, SFSU’s remote Sierra Nevada Field Campus offers summer field courses where teams of students and faculty spend a week immersed in research. The field campus also provides a location for locally centered research projects. Graduate students frequently use these field experiences to support their thesis work, and faculty encourage student employment on grant-funded research whenever possible.
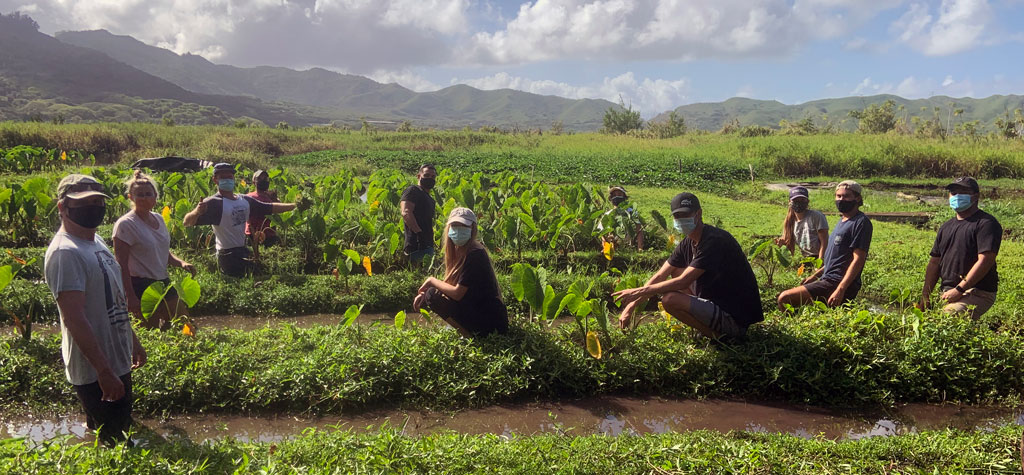
One project, funded by the state of California, focuses on the restoration of Sierra Nevada Mountain meadows, which have long been degraded by agriculture, mining, and forestry. With numerous faculty who specialize in remote sensing and biogeography, collaboration with community partners such as the Mountain Maidu Consortium, whose Indigenous stewardship of these landscapes spans centuries, is essential. These partnerships represent the school’s holistic approach to environmental research: recognizing that complex spaces — like mountain meadows — cannot be understood through a single disciplinary lens.
When it comes to recounting student success, “it’s about the daughter of immigrant farm workers from the Salinas Valley, now working for the California Department of Food and Agriculture, advising farmers on healthy soil practices.” Oliphant goes on, “Or a recent graduate from the Pitt River Nation who’s working for the USGS, monitoring Northern California lands, part of his tribal community.” This kind of transformative student success is part of the reason SFSU was ranked 8th nationally for social mobility in 2024 by the U.S. News & World Report.
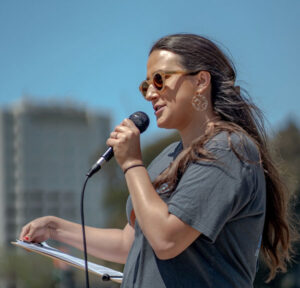 Geography was always there, just out of sight for Julia Dowell. Growing up in Long Beach, California, she was aware of the impacts of industrial, gas plants, and high-traffic arterial concentrated in the backyard of marginalized communities. “With my background, if I was going to do anything with my life, it had to be using environmental science and policy to right these wrongs. Studying geography and bringing in all those concepts was the best way for me to be able to do that kind of work.”
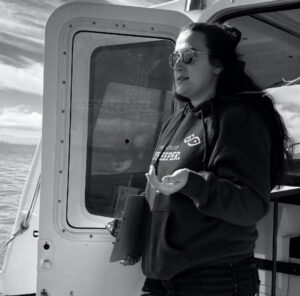 In Dowell’s previous job at environmental nonprofit, the