Glen MacDonald on Remembering John Muir

Remembering John Muir on the Centennial of His Passing:
Writer, Naturalist, Scientist, Activist, Geographer?

[Glen MacDonald also is organizing a featured panel session, “Geographers on John Muir: Assessing His Legacy and Relevance After 100 Years,” for the 2015 AAG annual meeting in Chicago, April 21-25. More information will be available soon.]

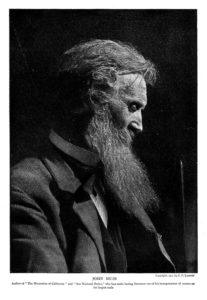
John Muir died in Los Angeles, California on Christmas Eve, 1914 with the pages of an unfinished manuscript on Alaska beside him in his hospital bed. As we mark the centenary of Muir’s passing what might we say about him from the perspective of Geography? Muir can claim many titles — writer, naturalist, scientist and environmental activist. Can we also consider him a geographer? Certainly Muir worked and wrote in a very formative period for American Geography and the Association of American Geographers. Although he received honorary degrees from the University of California, Wisconsin, Harvard and Yale, Muir never earned a formal university diploma. He did, however, attend the University of Wisconsin for two years starting in the 1860’s. Alas, this was long before the establishment of the Department of Geography there. But then founding lights of the AAG, including William Morris David, educated in the 19th century like Muir, did not hold degrees in the then incipient field of geography either. In Muir’s case his academic interests focused on chemistry, geology and botany. Through Ezra Carr, a Professor of Natural Sciences, Muir was likely introduced to the then revolutionary theories of Louis Agassiz regarding Pleistocene glaciation and this became a lifelong interest. Muir would also become acquainted with the controversial theories on evolution articulated by Charles Darwin in The Origin of Species. Although Agassiz was to remain deeply hostile to Darwin’s theory of natural selection, the ideas of both of these men were highly influential in the thinking of Muir as well as creators of the AAG such William Morris Davis. More than this though, Muir, like Davis and every geographer of the time, was profoundly influenced by that foundational figure of modern geography, Alexander von Humboldt. Indeed, in 1866 Muir wrote to his mentor and confident Jeanne Carr “How intensely I desire to be a Humboldt!” Muir’s regard for Humboldt, his intellectual development in the natural sciences and his intense interest in combining both geology and botany reflects the same scholarly, and at the time revolutionary, crucible that formed the science of Davis and Clements. By inclination and available education he was arguably as much a geographer as many of the founders of the AAG.

A scan of a more than 100-year-old photo of Muir by C. F. Lummis taken in 1901.
Owned by: Glen M. MacDonald
John Muir Memorial Chair
Distinguished Professor of
Geography,
Ecology and Evolutionary Biology and
The Institute of the Environment and Sustainability
UCLA
Los Angeles, CA
90095-1524
310-825-5008
macdonal@geog.ucla.edu

Like Davis, Muir was a sharp observationalist-inductivist who moved beyond the descriptive confines of natural history and sought to explain nature rather than simply observe and record. Within the earth sciences, Muir’s work on glacial features and evidence of past glaciation coupled with his theory on the glacial origins of Yosemite and other Sierra Nevada valleys stands as an important and lasting contribution. Physical geography is sometimes delineated from geology through its attention to modern processes and landforms. In this regard Muir showed a similar inclination. He was the first to discover living glaciers in the Sierra Nevada. This work, published in 1873 in the American Journal of Science and Arts must have been particularly sweet for Muir as it reinforced his position in a well-known scientific disagreement with Josiah Dwight Whitney, a Professor of Geology at Harvard and head of the California Geological Survey, who argued, incorrectly, that the Yosemite Valley was a tectonic feature. However, if geography is indeed the integrative science, then Muir was to more than equal many founders of the AAG in his desire and capability of spanning the earth and life sciences. Muir wrote many descriptions of the distributions of montane and alpine flora, but my favorite, and certainly most integrative was his study of the giant sequoia (Sequoiadendron giganteum). In his 1876 monograph published as a Proceedings of the American Association for the Advancement of Science, Muir analyzed the contemporary distribution of the species along the west slope of the Sierra Nevada, noted its environmental relations and particularly its disjunct distribution. The latter he attributed to the fragmentation of its range by Pleistocene glaciers emanating from the High Sierra. Now, today we know Muir had an overstated belief in the extent and role of glaciation and new research shows that the geographic distribution of giant sequoia may largely be explained by micro-climate, but the questions he asked remain topical. Muir also presaged the current focus of many geographers on the long-term trajectories and uncertain future of plant animal species in the face of human impact. Consider his pondering the future of the giant sequoia in his 1876 “What area does Sequoia now occupy as the principal tree? Was the species ever more extensively distributed in the Sierra during post-glacial times? Is the species verging on extinction? And if so, then to what causes will its extinction be due? What have been its relation to climate, soils and to other coniferous trees with which it is associated? What are those relations now? What are they likely to be in the future?” These are the same questions biogeographers are asking about a multitude of endangered species.

Muir’s scientific work and his writings were no doubt well known by many of the founders and first members of the AAG. What of his actual engagement with professional geography and his regard by the discipline at that time? It is notable that Muir was a member of the Committee for Arrangements, along with William Morris Davis and a number of eminent geographers for the 8th International Geographic Congress in 1904. His impact on our discipline clearly transcended his passing. It is striking to me that the 1958 Honorary Presidential Address by John Leighly at the first Annual Meeting of the AAG to be held on the west coast was entitled “John Muir’s Image Of The West.” I was alerted to Muir’s quote regarding von Humboldt through Leighly’s speech. Today, 100 years past his death, although citations to Muir’s scientific papers may be sparse, his ideas on the importance of past glaciations and his books such as My First Summer in the Sierra or Our National Parks remain widely known by geographers investigating questions of physical geography, conservation or human-nature perception and interactions. As Muir is in the pantheon of thinkers who developed modern environmentalism and conservation, it would be hard to find any geographer who has not been exposed to the work and philosophy of Muir in the course of their education. Geographer activists knowingly or unknowing are also taking a page from his book, most strikingly developed during his emotional and ultimately failed attempt to save the Hetch Hetchy Valley. For generations these ideas have undoubtedly helped formulate the thinking of geographers and through them the course of the AAG. So, although never formally a trained geographer, Muir was drawn by the same forces of curiosity and cross-disciplinary inquiry that have propelled geographers and geography over the past century.  I am inclined to consider him a true geographer and one of our seminal figures. As he so fervently desired in 1866, Muir was and is “a Humboldt.”  (John Muir: Born April 21, 1838, Dunbar, Scotland; Died December 24, 1914, Los Angeles, CA)

Glen MacDonald is distinguished professor and inaugural John Muir Memorial Chair in Geography at UCLA. He engages Geography with scholars, policy makers, writers, artists, activists and others to look at contemporary nature and people issues in the American West.

Glen MacDonald also is organizing a featured panel session, “Geographers on John Muir: Assessing His Legacy and Relevance After 100 Years,” for the 2015 AAG annual meeting in Chicago, April 21-25. More information will be available soon.

DOI: 10.14433/2014.0019

    Share

Symposium on Physical Geography at the 2015 AAG Annual Meeting

A special feature of the upcoming 2015 AAG annual meeting is the one-day Symposium on Physical Geography, scheduled for Thursday, April 23. The overall intent of the symposium is to raise the visibility of physical geography research at the AAG annual meeting, and provide additional networking opportunities to facilitate and enhance dialog among physical geographers on emerging developments, challenges, and approaches related to physical geography.

The symposium is also an experiment with alternative formats for physical geography sessions at future AAG annual meetings. Over the years there have been numerous informal conversations among members of the physical geography community regarding potential changes to the oral and poster sessions of the AAG annual meeting. Arguments have often been made for larger poster sessions and fewer oral sessions, under the expectation that these format changes would lead to increased session attendance and hence improved visibility within the discipline of the research efforts of individual physical geographers and enhanced popularity of the AAG annual meeting among physical geographers. Reference is often made to the formats of popular meetings of other geophysical-related scientific organizations, which typically include a small number of themed oral sessions that are selected by an organizing committee from proposals by members, with the majority of the attendees’ research contributions displayed in large poster sessions. Many of these arguments were raised again at the special session, Conversation on the Future of Physical Geography, held at the 2014 AAG annual meeting in Tampa. With these recommendations in mind, AAG past presidents Carol Harden, Richard Marston and Julie Winkler organized the one-day symposium as a modest, but manageable, effort to explore the potential for alternative session formats and implications for other components of the AAG annual meeting.

The Symposium on Physical Geography will feature two morning sessions of invited presentations around the theme, Environmental Reconstruction–A Nexus of Biogeography, Climatology and Geomorphology. This integrative research theme was selected as it cuts across the many facets of physical geography and encompasses the study of past climates, landscapes and biological systems, along with the reclamation of altered environments. The afternoon will be devoted to an extended poster session in a new mode, with up to 100 posters on display during the entire afternoon. Poster presentations are being solicited on all aspects of physical geography, including environmental reconstruction, and the posters will be grouped by theme and/or specialty group. Presenters will post the times next to their poster when they will be available for discussion with viewers, although they are encouraged to stand by their poster during at least a portion of the period from 4:30-6:30 p.m. The symposium will conclude with a happy hour from 4:30-7:30 p.m.

The symposium will be followed by a second Conversation on the Future of Physical Geography, scheduled for Friday, April 24, 11:45 a.m. At this time, attendees will have an opportunity to reflect on the symposium (both its strengths and weaknesses), consider whether this type of structure warrants further experimentation, and, if so, recommend strategies for selecting themes and symposia organizers for a 2016 Symposium on Physical Geography. The long-term goal is to develop meeting formats that support the careers of physical geographers and enhance physical geography within the AAG.

Physical geographers at all stages of their careers are strongly encouraged to submit an abstract for the Thursday afternoon poster session. The deadline for abstracts is November 5, 2014. Please indicate as a Special Request on the online abstract submission form your interest in being part of the Symposium on Physical Geography poster session, and email a copy of your abstract confirmation to Professor Carol Harden (charden [at] utk [dot] edu). Specialty groups are urged to co-sponsor the poster session, and to also use the poster session for some of their own activities such as student poster awards.

Updates on the Symposium on Physical Geography will be posted on the AAG website

and also communicated via the AAG Geogram. Please contact Carol Harden (charden [at] utk [dot] edu), Richard Marston (rmarston [at] k-state [dot] edu), or Julie Winkler (winkler [at] msu [dot] edu) with questions or suggestions for the Symposium on Physical Geography. We hope to see you in Chicago!

    Share

Who’s got your back? Domestic Workers in Chicago

By the early 1980s, the introduction of neoliberal policies across urban America profoundly impacted its already declining industrial base. In Chicago, from 1972 to 2000, manufacturing employment plunged by nearly 260,000 jobs (and thus decent blue-collar wages). Soon the industrial economy was replaced with a service economy that consisted of low-wage service jobs with no social protection, unionization, or opportunities for promotion. This economic transition, coupled with an increasing demand by middle-class families, provided the principal conditions for the expansion of the domestic work industry.

Since the early 2000s this industry has critically expanded in mayor metropolitan cities in the US, and Chicago is no exception. Today, an estimated 200,000 domestic workers constitute the invisible backbone of Chicago’s economy.

The Nature of Domestic Work

According to the International Labor Organization (ILO) Convention # 189, domestic work consists of work performed in or for a household or households,. It usually includes cleaning, shopping, cooking, caring for the sick or elderly, caring for children, and looking after pets among other tasks. Many domestic workers live in the home of the family for which they work. Those who do not live in the employer’s home often work for several employers, generally for only a few hours per week for each employer.

Unlike many work industries, domestic workers operate in a largely unregulated and unprotected arena. The army of housekeepers, caregivers, cleaners, and nurses, enable thousands of Chicagoans to go to their jobs every day. Yet, despite this needed and growing workforce, domestic workers suffer from few labor protections and demanding working conditions. According to the ILO 2011 Report, these workers typically earn around 40 percent of average wages in their country. They often have no limit to the hours they work, are rarely entitled to rest periods, are not paid the minimum wage and do not receive employee benefits such as maternity leave.

In the US, domestic workers are explicitly excluded from the protections of key federal labor and employment laws and standards. The 1935 National Labor Relations Act, which originated in racists regulations to prevent African-American workers in the southern states to join unions, guarantees workers’ rights to form unions, choose representatives, and bargain collectively. However, the law does not apply to either farmers or domestic workers. Nor does the federal anti-discrimination law which only applies to companies with multiple employees. Domestic workers are also excluded from the protections of the Occupational Safety and Health Act. Live-in domestic workers, who are especially subject to unreasonable and uncompensated demands on their time, are excluded from the overtime provisions of the Fair Labor Standards Act.

Yet, their contributions to families around the country are limitless. Domestic workers provide emotional, physical and social support for children, elders, and working family members. The labor provided by domestic workers is the labor that makes all other work possible. Households are looked after, children are raised and cared for and elders are comforted and assisted. Due to these responsibilities and tasks provided by domestic workers, families are able to go to work in peace and know that their most important assets are in good care and protection.

Why this job is unseen or remains unseen and unregulated is in many ways attributed to the capitalist logic: something that does not generate value or facilitates its exchange is devalued or rendered socially invisible. Additionally, it is difficult to quantify, measure, and assign a value to the tasks performed by the domestic workers in capitalist terms. Nevertheless, housecleaners and nannies typically take great pride in their work even when it goes unnoticed or unappreciated by their employers. Nannies develop a lot of affection with the children they take care of and, in some cases, play a stronger parental role than the children’s parents.

Contributing to the invisibility, many things get confused in this type of industry to the disadvantage of domestic workers and the benefit of the employer. Domestic work is not recognized as employment in the traditional sense; it is performed in someone’s home, not in a conventional workplace. In domestic work, the home and workplace is one and the same.

Related to the home-workplace conflation is the fact that domestic workers are not any type of worker. They maintain intimate relationships with their employers. Following Barbara Ehrenreich “what distinguishes domestic workers from other service workers, say, retail, hotel, or sales employees, is the intimacy of their relationship to their employers” (in Burham and Theodore, 2012:7). Most service-workers are unlikely to even know the names of anyone higher up in the corporate hierarchy than her/his immediate supervisor. In contrast, most domestic workers are employed directly by the families they serve. They work or live in their employers’ homes, and may even sleep in one of the children’s rooms.

Some employers view these workers as “members of the family”. But many other employers take advantage of this relationship, which has allowed certain abuses to occur and go unaddressed. Such abuses include workers not being paid overtime or being asked to perform extra duties without compensation. As such, many of the problems arise because domestic workers operate without written contracts.

Domestic Workers Organizations in Chicago

On May 22nd 2014, I invited Gaby Benitez, an ex-organizer and coordinator for the Latino Union of Chicago, to give a presentation in my undergraduate-seminar on Domestic Workers Economy at DePaul University. Latino Union is an organization that, among other initiatives, has created different programs to help domestic workers educate themselves about their rights, current policies, and their health and safety. Accompanying Gaby was a friend and domestic worker named Vicky. In the session, Gaby delivered a great presentation on history of the Latino Union, different aspects of domestic work, and the organization itself. She concluded her presentation summarizing some of the main findings of an empirical study on the domestic work industry conducted in 2012 by the Center for Urban Economic Development, at the University of Illinois at Chicago. The research team in charge of this study surveyed 2,086 workers in 14 US metropolitan areas. Among other findings, this study reported that 70% of domestic workers in the US earn less than $13 an hour, 28 percent of nannies are paid less than the minimum wage, the median hourly wage for live-in domestic workers is $6.15, and less than 2 percent of domestic workers receive retirement benefits. Gaby remarked that due to these conditions, domestic workers are not able to save money, are barely able to pay their bills, make payments that are regularly late, and have difficulty in buying food. Additionally, she stated that 23 percent of workers have been fired from jobs after complaining about working conditions and 29 percent of caregivers surveyed had suffered a back injury at the time the survey was conducted.

Gaby’s presentation was followed by Vicky’s testimony. Vicky who is in her mid-50’s, worked as a housekeeper and nanny for 30 years. In her last job as a housekeeper, she lived in deplorable conditions at her employers’ house. She was given a room in the basement which was infested with rats and had a putrid smell that would waft up from the sewers at a constant interval. These conditions were literally making her sick. After a few months living and working in that home, she was forced to quit her job because of the toll it was taking on her health.

In Chicago, “Latino Union” and “Arise” have joined the fight for domestic workers’ rights and better working conditions. Both organizations provide training on how to use green products in the work area, operate computers and other technology, and offer English classes. Besides this, they offer workshops that teach domestic workers how to build and paint and do certain tasks on the job. By doing this, the organizations guide and support domestic workers in acquiring better skills for themselves and become educated professionals in the workforce.

Domestic Workers Bill of Rights

Both Latino Union and Arise are also part of a larger movement that has started recently, more precisely in 2010 in New York. The battle was long and hard, but after six years of organizing together with unions, employers, and community organizations, the New York State Legislature passed the Domestic Workers Bill of Rights on July 1, 2010. This was a crucial step towards building a national movement in the struggle for labor rights, the protection of the workers, and an end to exploitation and abuse.

Under this bill, domestic workers in NY were finally recognized as part of the workforce. The bill includes the following protections requiring employers to: provide one day of rest per week, one meal and one rest break a day, pay no less than the minimum wage, pay for all hours worked, give paid time off, keep a contract, and provide a workplace environment free from sexual harassment, A similar bill in California was vetoed in 2012.

In 2013, was the turn of Hawaii, and very recently this year of Massachusetts to pass the Bill of Rights. Domestic workers in the Chicago area are ready to join this movement, to no longer stay hidden in the home. They need organized support, steady advocacy, and collaboration between many different groups, organizations, institutions, and individuals.

In sum, the labor provided by domestic workers is the labor that makes all other work possible. Today Latino Union of Chicago and Arise accept volunteers and people who wish to help domestic workers achieve their dream of being treated fairly in their working environment and in having decent jobs to provide for themselves and their own families. Finally, when you attend the AAG in Chicago this year, bring this or similar topics into debate, stand up, make a choice and change lives. Now is the time.

—Carolina Sternberg
csternb1 [at] depaul [dot] edu

DOI: 10.14433/2014.0020

    Share

GIS in Chicagoland

The prevalence of GIS and digital mapping in the Chicago region is nothing new. The footprints of GIS are everywhere. Local government offices were early adopters of mapping technology, using GIS and spatial analysis to maintain or improve their interests. Currently, it is difficult to find a local government office in the region that does not have its own GIS department. If none is present, the offices often use an outside consultant, like MGP Inc., which performs geospatial tasks for them. Regional GIS associations like the Illinois Municipal Arc Users Group exist almost entirely to serve government GIS users in the region and have heavy participation.

While most academic institutions in Chicagoland have modest GIS or Geography programs in terms of relative size, their faculty, students, and research definitely have noteworthy quality and content. Northern Illinois University (DeKalb, IL), University of Illinois at Chicago (Chicago, IL), DePaul University (Chicago, IL), and Elmhurst College (Elmhurst, IL) are just some of many in the region that offer graduate and/or undergraduate degrees with concentrations in GIS along with GIS certificate programs. Other institutions still recognize the importance of GIS and carry it as a primary subject in a variety of classes, such as the University of Chicago (Chicago, IL).

Other Local non-profit organizations use GIS for various purposes that you can likely guess just given their names. The Alliance for the Great Lakes, Archdiocese of Chicago, Chicago Teachers’ Union, Illinois Natural History Survey, Metra, and The Chicago Community Trust, are just a few out of hundreds. Other organizations in Chicagoland promote GIS usage and collaboration among its members like the Illinois GIS AssociationGeographic Society of Chicago, and the Chicago GIS Network .

Finally, many recognizable corporations and businesses based in Chicagoland use GIS and spatial analysis to accomplish all sorts of tasks from market research to site placement and from human resources to transportation logistics. McDonald’s, Walgreens, Potbelly’s, and Aon along with scores of others, employ GIS on a daily basis. Chicago is also home to other entities like HERE which is a global leader in providing mapping and location intelligence data.

However, with all this GIS use going on, the Chicago region is not really a stand out. It is more of an example of what has been happening in other metropolitan areas around the United States and around the world. People recognize the power of spatial analysis and GIS. One by-product of this recognition is the hunger for more location-based data. Even though Chicago area GIS users are equal to others in terms of who is using GIS and spatial analysis, Chicago is far ahead of its peers in terms of answering the call for more spatial data.

Approximately three years ago, the city of Chicago committed to an open data initiative that would theoretically inform policy and improve services by putting municipal data in the hands of anyone who wanted it. Today the city of Chicago’s data portal provides a huge number of records to the general public. A large percentage of the data is location-based. The site has been a major success and influenced Cook County, which includes the City of Chicago, to release their data in the same manner.

This open data allowed researchers, concerned citizens, application developers, and any general map lover to download any or all location-based data from these portals and begin to analyze and display phenomena happening in the metropolitan area. Open City is just one group in the region that creates applications with open data to improve transparency in operations. Many of these applications involve spatial data and mapping applications.

Clear Streets is a good example of these applications and a favorite among Chicago residents. During or after a snow event, Clear Streets displays on a map which streets have been cleared of snow along with a time stamp of when it occurred. The City of Chicago’s snow plow tracker website conveys real time information on where snow plows are in the city. However, users do not know whether their street has been plowed or not. That is where Clear Streets steps in and gives an accurate depiction of what parts of the city have been plowed (at least once) using the data feed from the city’s plow tracker site.

Another mapping application, Is There Sewage in the Chicago River?, tracks sewage dumps into the Chicago River and plots them on a map. Chicago Bike Crash Reports pinpoints every location in Chicago where a bike accident occurred and had a police report filed along with it. One of the more attractive applications built with this publicly available data is Edifice which tracks the city’s built environment.

The list of datasets available is staggering. This initiative in the Chicago area has led to similar data distribution efforts in the region and in other cities like New York, Boston, and Los Angeles. Using this location based data just from a visualization standpoint gives a greater understanding to the geography of the region and how different processes may work together to form the landscape.

GIS use is at the forefront of this initiative because it is the perfect marriage between maps and data. From here, spatial analytics and statistical methods can provide evidence to whether urban planning initiatives are working, crime is being reduced, or potholes are getting filled. These questions may seem simple to answer but become far too complex to handle in any other fashion when the scale is increased to encompass such a large area.

Other sites to note:


—Todd J. Schuble
Manager of GIS Research/Senior Lecturer
University of Chicago

DOI: 10.14433/2014.0017

    Share

Illinois Agriculture

It’s no secret, especially to its residents, that Illinois is a divided state. There’s Chicago, and then there’s not Chicago. However, Illinois’ rural farming region should not be overlooked when it comes to appreciating and understanding what makes this state tick. While calling oneself a farmer is as simple as being able to annually produce and sell more than $1,000 of agricultural goods (something my wife’s never-ending herb garden could likely do in most years), the number of farms in and around Chicagoland has increased. Since 2002, Illinois has lost just over 2,000 farms, yet the number of farms in the Chicago Metropolitan Statistical Area has increased, due in large part to the addition of smaller farms, less than 200 acres in size, that cater to the region’s ever-increasing demand for local, fresh food (more on urban agriculture in an upcoming Newsletter piece).

According to the U.S. Geological Survey’s 2011 National Land Cover Dataset, 70 percent of Illinois’ land cover was classified as either cultivated cropland or pasture/hay (FIGURE 1). The state ranks 7th in the U.S. in total agricultural sales ($17.2 billion), but ranks 3rd when considering only the sale of crops such as corn and soybeans, which in 2012 covered over 95 percent of Illinois’ cropland. Illinois farmers produce between 15 and 20 percent of the U.S. total combined corn/soy crop annually (FIGURE 2). East-central Illinois was the country’s first major cash-grain farming region. Known as the Grand Prairie, this region, prior to Euro-American settlement, was a large grassland/wetland/oak savannah ecosystem. Because of its lack of relief it was poorly drained and largely ignored – except for cattle barons who used the untillable land as pasture – as the state was being settled in the 1800s. As decades passed, and as drainage ditches were dug and clay field tile were installed, the productive capacity of this region’s fertile soil was eventually realized. As these large parcels of pasture were tilled, and because individual landowners could not farm it all themselves, it necessitated the beginning of the now ubiquitous system of renting privately-owned cropland to others; a system by which landowners are paid a per-acre sum by a tenant who maintains the owner’s land. In Illinois, and across much of the rest of the Corn Belt, well over 50 percent of all farmland in most counties is rented.

Figure 1. Illinois Land Cover, 2011.


Figure 2. Percent of harvested cropland planted to corn or soybeans, 2012.


Most farms in Illinois have grown over the years. Of the state’s 75,000 farms, nearly 8,000 (~10 percent) are 1,000 acres or larger. However, those 8,000 farms maintain over half of all of the state’s farmland. The idea that these big, “corporate” farms are industrializing the agricultural landscape is yarn easily spun to the uninformed, but one that is blatantly incorrect. In 2012 Illinois had 3,716 corporate farms. This seems impressive, especially when the prototypical “family farm” continues to disappear, but 90 percent of these so-called “corporate” farms were, in fact, what the U.S. Department of Agriculture refers to as “family corporations” (FIGURE 3). In other words, they were still family farms. The land was not owned by Cargill, Monsanto, or any of the other large, multinational corporations often blamed for the demise of farming (although such corporations do have considerable influence in modern U.S. agribusiness), but for tax purposes the family had decided to create a business. In reality, only 0.5 percent of Illinois farms are non-family, corporately-owned entities. These non-family, corporate-owned farms work an equally small percentage of the state’s total agricultural land – 0.7 percent. The Illinois “corporate” agricultural landscape mirrors exactly that of the entire United States: 0.5 percent of farms, 0.7 percent of farmland…numbers that have changed little over the past four decades.

Figure 3. The large-scale equipment of a family farm. From left to right: corn-harvesting combine, semi tractor/trailer (in background), and grain cart/tractor.


Chicago’s importance in U.S. agricultural production and processing, by and large, has waned over the past half-century. Once the center of our country’s beef (and to a lesser extent pork) processing industry, Chicago, save for a handful of specialty uses for corn-based products (e.g. high fructose corn syrup), sees little of what is produced in much of the rest of the state. If not used locally to produce biofuels or to feed Illinois’ dwindling numbers of livestock (Illinois accounts for only 1.2 percent and 6.6 percent of U.S. cattle and hog sales, respectively), most corn and soybeans are brought from the fields in which they grew to one of the many hundreds of giant, glistening grain elevators that can be found along Illinois’ railroad lines – many of which head south to out-of-state processing facilities or to ports along the Mississippi River where they will continue south for export out of the Gulf of Mexico (FIGURE 4).

Figure 4. Modern grain elevator and storage at Coles Station, between Mattoon and Decatur, IL.


Geographer William J. Doolittle said, “Agriculture may well be the most comprehensive of geographical topics. It involves modification of both the biological and physical components of the environment, and it incorporates social and economic components with distinctive spatial manifestations” (Annals of the Association of American Geographers, Vol. 82, pp. 386-401). Agriculture and rural areas will be the focus of a number of sessions at the upcoming Chicago meeting. Indeed, many have already begun to take advantage of these topics’ increasing breadth and depth by reporting on – at AAG Annual Meetings – the myriad issues related to our rural and agricultural landscapes (FIGURE 5). We hope you will join us!

Figure 5. Number of rural- and agricultural-themed papers/posters presented at past AAG Annual Meetings.

— Chris Laingen
Eastern Illinois University

DOI: 10.14433/2014.0015

    Share

Geographers Study Chicago

When the AAG returns to Chicago in 2015 for its third annual meeting in 20 years, participants will be revisiting the site of a lively field of inquiry for the study of cities.  Beginning with the famed “Chicago school sociologists” of the 1920s, the city has served as a model of urban form and function for generations of social scientists.  In the words of geographer Brian J.L. Berry, Chicago was “the classic laboratory for urban analysis in the United States.”  In 1963 Berry and his students, James W. Simmons and Robert J. Tennant, published “Urban Population Densities: Structure and Change” (Geographical Review, Vol. 53, pp. 389-405), a penetrating study of population density patterns found in Chicago and in cities around the world.

The focus of their study was “a single empirically derived expression

dx = d0 e-bx

“where dx is population density at a distance x from the city center, d0 is central density and b is the density gradient [p. 389].”  Variations on this expression had already appeared in dozens of previous studies they cited.  It would be modified and tested repeatedly in the years that followed and become a staple of geography textbooks.

Berry and his students had already gone well beyond the simple model.  They presented evidence showing that the gradient value, b, typically falls over time in Western cities, presumably as a function of urban growth.  They also proposed that the central density, d0 , typically increases then falls, but they presented no systematic argument as to why this should be so.  They concluded (p. 404) “regardless of time or place,” the model provided “a statistically significant fit to the distribution of population density within cities.”

How has the urban density model fared as a predictor in the decades since their paper appeared?   When they wrote,  the city of Chicago had just reached its maximum population to date  of 3.6 million.  With occasional decadal increases, the city’s population has fallen to around 2.7 million at present.  While such a decrease (25%) might be consistent with the urban density model, given the prediction that central densities fall over time, the behavior of the density gradient itself is difficult to reconcile with their model.


The density curve has taken on a very different shape during the past six decades.  In 1950 peak population densities averaging 35,000 persons per square mile were observed roughly 3 miles from downtown.  The “density crater” at the very center of the city, where land was devoted more to commercial, office, and transportation uses than to residences, was an assumed correction to be made to the model.   But beyond that, density decreased at a fairly uniform rate in 1950.

In 2010, the pattern of population densities beyond 8 miles from the city center is almost identical to what it was sixty years earlier.  But a massive reduction in population has taken place within 8 miles of downtown.  While many census tracts on the north side of the city grew substantially over this period, the typical census tract south of downtown Chicago declined.  This “unbalancing” of Chicago, with a shift of population, resources, and employment opportunities  to the north, away from the south side, has been a hallmark of the six decades leading to the present.

The heart of the city’s south side, bounded roughly by Roosevelt Road on the north, 79th St. on the south, and Western Avenue on the west, had a population of 800,000 in 1950, which was 45% African-American.  In 2010 that same area contained fewer than 500,000 inhabitants, 58% of whom were African-American.

High-density living, once a hallmark of Chicago’s many neighborhoods, African-American as well as Euro-American, declined markedly during the 60-year period.  In 1950, 2.8 million people lived in census tracts that had a density greater than 15,000 persons per square mile.  In 2010, only 1.69 million persons lived in census tracts with a density at least that high, a reduction of roughly 40%.   Living in more compact, denser environments, while often promoted as a characteristic of sustainable cities, has declined drastically in Chicago during the past six decades.

Did the urban population density model studied by Berry and his students fail the test of time?  The gradient is still there, out toward the edges of the city, and it has scarcely changed at all in six decades.   A reduction in central density accompanying depopulation of the inner city was not envisioned in their model, nor were the factors that brought it about.    Chicago’s experience offers good evidence that cities remain entities that merit the geographer’s close attention.

—John C. Hudson
Northwestern University

DOI: 10.14433/2014.0013

    Share

A Decade of Change: AAG Returns to Chicago

The AAG is pleased to be holding its next annual meeting April 21-25, 2015, in the world-class city of Chicago.  The AAG last met in Chicago in 2006, and in the newsletter issues leading up to the 2015 meeting, the Local Arrangements Committee (LAC — chaired by Professor Euan Hague, Chair of the Geography Department at DePaul University) will provide articles that highlight some of the more dramatic changes in Chicago since then. This first article provides an overview of some of the themes of change discussed by the LAC at its first Chicago meeting on May 24, 2015 — these themes will be presented in greater detail in coming issues.


The AAG 2015 conference hotel, Hyatt Regency, 151 East Wacker Drive, Chicago


Population Redistribution

The 2010 Census reported that the 16 county multi-state Chicago–Naperville–Michigan City, IL–IN–WI Combined Statistical Area (2004 definition) had a population of 9.68 million.  That means that the Chicago region grew by 4 percent between 2000 and 2010, which was considerably slower growth than the previous decade (1990 to 2000) when the same 16 county metropolitan area grew by 11.1 percent.  The population loss in Chicago proper (with the exception of its Downtown) and the inner suburbs was largely responsible for the growth slowdown, for instance between 2000 and 2010 Chicago lost over 200,000 residents.  Meanwhile, the outer suburbs helped offset these latter declines, for instance the 3 largest outer suburbs of Chicago (Aurora, Joliet, and Naperville) together added 109,616, a little over half the amount that the City of Chicago lost. This reflects a continued long term trend in the Chicago region of population decentralization from Chicago’s core to the edge, despite a slight pause in that trend in the 1990s when the City of Chicago actually gained population for the first time since the 1950 Census.  Meanwhile Downtown Chicago deserves special attention as its population saw a 114 percent increase from 1990 to 2010.  This population increase was paralleled by a residential housing boom that has included the conversion of former Downtown office spaces to residential units and new high-rise apartment buildings and condominiums have sprouted up in and around Downtown – a theme that was highlighted in a special map provided to AAG attendees at the 2006 AAG meeting.

The LAC is working on field trips that will showcase various aspects of Chicago’s recent population redistribution trends and an upcoming newsletter will go into greater detail on these population shifts.

A Greener Chicago

The 2006 AAG meeting publications highlighted Chicago’s efforts to expand upon its rich heritage of city parks and greenways and those efforts have continued.  The Openlands Project was founded in 1963 and since then it has helped secure, protect, and provide public access to more than 55,000 acres of land for parks, forest preserves, land and water greenway corridors, and urban gardens.  Participants of the AAG meeting will be able to link up with this vast network of greenways within walking distance of the conference hotel.  Just blocks away is Millennium Park which is currently celebrating its 10th anniversary and special events continuing into 2015 will celebrate this magnificent park space by showing off its world-class art, music, architecture, and landscape design.  Another “green” milestone reached by Chicago’s is its commitment to bicycling as it has built over 200 miles of on-street bike lanes including one that weaves 1.2 miles through downtown within a buffer that separates it from cars.  Chicago also has a Divvy (divvybikes.com) bike sharing program with the largest number of stations of any city in the United States.


Corner of Monroe and Canal Street, Chicago, by author 24 May 2015.


The LAC is already working on field trips that will visit components of the greenway system of Chicago and an upcoming newsletter will go into greater detail on many other aspects of the greening of Chicago.

Chicago’s Food Systems

The Chicago region is the command and control center for U.S. industrial agriculture (center of the Corn Belt) yet it is also a leader in alternative agricultural systems including a very active local food movement that emphasizes organic and natural choices.  The Chicago food theme is one that the LAC is particularly interested in as several members are actively researching the issues, so upcoming newsletter stories will review the status of the region’s ties to traditional industrial agriculture as well as the growth in alternative systems.  As coincidence would have it when the LAC met on Memorial Day 2014 weekend a massive crowd of protestors assembled in the Loop to demonstrate against the use of genetically modified organisms (GMOs) and to promote a call for locally grown organic alternatives.


GMO protest at Federal Plaza on Jackson Blvd and Clark Street, Chicago, by author 24 May 2015.


The LAC is working on field trips that will visit parts of the corn-belt within range of Chicago and it will also show case locally grown components of the new Chicago food system including retail configurations that attempt to turn food deserts into food oases.

Lake Michigan and other Regional Water Resources

Chicago sits adjacent to Lake Michigan and the growth of the metropolitan region’s population and spatial extent have caused concern among regional planners over the potential for future water supply shortages.  The Metropolitan Planning Council (MPC) is promoting a regional approach to sustainable water supply planning and management.  Chicago and many of its inner suburbs are already withdrawing Lake Michigan water to meet their needs and as the outer suburbs speculate about their own future shortages from dwindling local ground water supplies they are being warned that Lake Michigan water may not be available.  All of this may seem odd given the vast size of Lake Michigan, but international laws with Canada limit withdrawals.

The LAC is working on the development of a field trip to showcase these and other regional examples of innovations in water resources management.  Views of the Chicago River and Lake Michigan are a close walking distance from the conference hotel and just a little further, just a mile, is Navy Pier which puts you slightly above and out onto the Lake.

Transportation 

Chicago is a large centralized gateway to international trade and traffic for the United States.  Chicago continues to grapple with the growth in freight flows that often test the capacity of the region’s transportation infrastructure.


Photo taken from a freight yard in Southwest Chicago on 28 May 2005.


As in 2006, almost all of the container freight on these railcars is transferred to and from trucks which take up twice the road space of cars on the region’s highways.

On top of the container-freight issue, the Chicago region is grappling with a host of other transportation issues including the goal of expanding public transportation services.  The edge cities toured during the last AAG meeting have matured and exhibit both traditional and reverse commuting patterns.  The Loop is still the dominant job center of the region and the peak commuting flows reflect this, however, there is a growing gentrifying population that works in the suburbs but lives and consumes in the city, which only adds more complexity to the pattern.  New retail configurations in the suburbs like Lifestyle Centers are adding to non-work related trips and suburban gridlock is common place on the weekends.  The Local Arrangements committee is working on field trips that will show-case some of the problems identified here as well as some of the existing plans that are in place to alleviate the problems.  The conference hotel is also directly accessible to public transportation, particularly the “L”, and extensive bicycle paths are within walking distance toward the Lake.

Race, Immigration, and Ethnicity

The LAC will write a newsletter piece prior to the meeting that articulates some of the changing dynamics and patterns of Chicago’s racial and ethnic diversity since the last meeting in 2006.  Topics to be covered will include the degree to which multiethnic neighborhoods have expanded or contracted or whether classic patterns of segregation have reemerged.  The piece will examine the tension that gentrification has posed to the stability of some of the city’s more stable ethnic enclaves.  The geographic dimensions of the growth in Chicago’s China Town will be described.

The Local Arrangements Committee already has plans to visit the Pilson neighborhood, a Latino neighborhood that has seen continued pressure from gentrification since the last meeting in 2006.

So as you plan your trip to Chicago, save time to explore these and many other aspects of change that Chicago has experienced since 2006.  Bring your walking shoes and depending on the weather you may even consider renting a bicycle to tour on the greenways of Chicago accessed in front of the conference hotel.  Venture into some of Chicago’s ethnic neighborhoods for unique dining experiences.  Or possibly even plan a journey from Downtown to the Edgeless exurbs of Chicago.

    Share

AAG 2014 Tampa: Publishing for Non-Native Speakers of English Sessions Now Online

“Publishing for Non-Native Speakers of English” was a presentation of two sessions held during AAG’s 2014 Tampa annual meeting. The sessions, co-organized by Mei-Po Kwan and Eric S. Sheppard, were designed to bring together editors, reviewers and authors giving perspective to publishing issues for non-native speakers of English.

Session I was chaired by Mei-Po Kwan and the panel included Helga Leitner, Bing Xu, Weidong Liu, Padraig Carmody, Barney Warf and Tim Schwanen.

Session II was chaired by Eric Sheppard and the panel included György Csomós, Annelies Zoomers, Canfei He, Henry Yeung, Kent Mathewson and Joseli Maria Silva.

The videos from each session are now available online.

Watch Publishing for Non-Native Speakers of English I

Watch Publishing for Non-Native Speakers of English II

    Share

East Lakes Division Team Takes 2014 World Geography Bowl

AAG East Lakes Regional Division 2014 World Geography Bowl Champions

The East Lakes Team won first place in the 2014 World Geography Bowl, an annual quiz competition for teams of college-level geography students representing the AAG’s regional divisions. The event was its 21st year for hosting during its Annual Meeting.

On April 11, seven teams, each representing an AAG regional division, competed at the convention center in Tampa. Of the nine regional divisions, the following seven was represented by a team: East Lakes, Great-Plains Rocky Mountains, Middle Atlantic, Middle States, New England-St. Lawrence Valley, Pacific Coast, and Southeast Divisions, A spoiler team was added, comprised of students present at the competition.

At the conclusion of the exciting competition, AAG President Julie Winkler, wrapped up the event with an uplifting message and presented the winners with prizes. Bob Dulli (representing National Geographic Society) partnered with Julie Winkler to give out the Atlas prize to second runner-up winners.

The winning East Lakes Division team’s roster was:

  • Steven Schultze (Team captain), Michigan State University
  • Alex Colucci, Kent University
  • Lisa Dershowitz, Miami (Ohio) University
  • David Eichenauer, University of Toledo
  • Michael Chohany, University of Toledo
  • Evgeny Panchenko, University of Toledo
  • Lisa DeChano-Cook (team sponsor/coach), Western Michigan University

The East Lakes team consisted of the top six scoring individuals from an on-line quiz that the region uses to determine the team each year. The team was coordinated by Dr. Lisa M. DeChano-Cook from Western Michigan University.

The first runner-up Middle Atlantic Division team’s roster was:

  • Raynell Cooper (Team captain), George Washington University
  • Owen Dowell, Salisbury University
  • Sam Hudis, George Washington University
  • Sara Hughes, Frostburg State University
  • Walker Skeeter, Salisbury University
  • Will Steckman, Frostburg State University
  • Tracy Edwards (team sponsor/coach), Frostburg State University

The second runner-up Pacific Coast Division team’s roster was:

  • Brendan Gordon (Team captain), University of Idaho
  • Crystal English, San Diego State University / University of California, Santa Barbara
  • Biniam Mengisteab, San Francisco State University
  • Daniel Phillips, University of California, Santa Barbara
  • Tina White (team sponsor/coach), Pasadena City College

The top five individuals with best personal scores were awarded an MVP prizes. Listed in order of most points earned:

  • Raynell Cooper, George Washington University
  • Brendan Gordon, University of Idaho
  • Pete Akers, University of Georgia
  • Kevin Bean, Bridgewater State University
  • Evgeny Panchenko, University of Toledo

Thanks to 2014 WGB prize donors and volunteers


Organizers of the World Geography Bowl would like to express thanks to the countless volunteer question writers, team sponsors/coaches, moderators, judges, and scorekeepers who make the competition possible, and to the many students who competed throughout the country. We would like to recognize the volunteers this year as: Andrew Allen (University of Kansas), Casey Allen (University of Colorado Denver), Don Colley (San Diego State University), Jamison Conley (West Virginia University), Richard Deal (Edinboro University), Suzanne Dickens (Front Range Community College), Dawn Drake (Missouri Western University), Robert Edsall (Idaho State University), Emily Fekete (University of Kansas), Peggy Gripshover (Western Kentucky University), Melvin Arthur Johnson (University of Wisconsin – Manitowoc), Patrick May (Plymouth State University), Lee Nolan (Pennsylvania State University), Wesley Reisser (George Washington University and U.S. Department of State), Zia Salim (San Diego State University/University of California, Santa Barbara), Michael Webb (University of North Carolina).

World Geography Bowl organizers thank its supporters who generously donated atlases, books, gift certificates, softwares, and MVP awards – Avenza Systems, Cambridge University Press, East View Press, Esri, Guilford Publications, Lonely Planet, McGraw-Hill Higher Education, National Geographic Society, The University of Chicago Press, and The University of Georgia Press – who recognize the important role the competition plays in building a sense of community and generating excitement around geographic learning. Your continued support is truly appreciated.

And, a heart-felt thank you was expressed to Andrew Shears, assistant professor of geography at Mansfield University, for his three-year term leading the tournament. This was his final year as World Geography Bowl executive director. Jamison Conley (West Virginia University) succeeds Andy Shears as the new executive director.

2015 World Geography Bowl – Chicago


The 2015 World Geography Bowl competition will be held in Chicago in April, 2015. Regional competitions typically occur during the fall at respective AAG regional meetings, where regional teams for the national competition are usually formed. For more information on organizing a team, contact the World Geography Bowl executive director, Jamison Conley, at West Virginia University at Jamison.Conley@mail.wvu.edu or Niem Huynh at nhuynh@aag.org .

Note: This post has been edited to reflect the correct yearly anniversary. In a previous version it erroneously stated that this event hit the 25th year milestone.

    Share

AAG 2014 Tampa Annual Meeting PDF Program

    Share