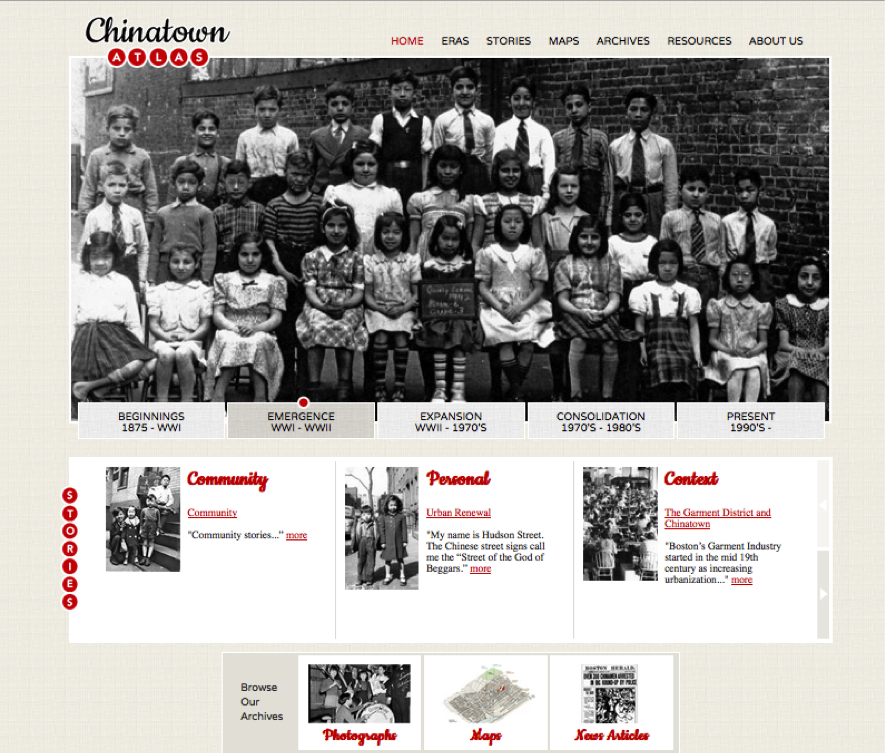
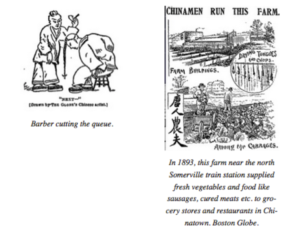
The Chinatown Atlas website tells the story of the development of Boston’s Chinatown (in the changing context of immigration and the physical and social growth of Boston and the region). It uses a combination of text, photo, maps, and stories to track the complexity of the changes.
Boston’s Chinatown is one of the few middle-sized Chinatowns that have survived from the Chinese Exclusion Act era. Today it is the economic, social and cultural center for working-class Chinese in the metropolitan area (mostly Cantonese and Fujianese speaking immigrants). It also serves East and Southeast Asian population and tourists.
In a city known for its ethnic neighborhoods, Chinatown was always different. It was not where most Chinese lived. It was established to serve the laundrymen who lived in isolation in other neighborhoods and industrial towns. They came into Boston on Sundays to socialize in the company of their countrymen. Even as laundries gave way to restaurants and immigration laws changed, Chinatown remains until today the center of social life and provided the necessary goods and services for working class Chinese.
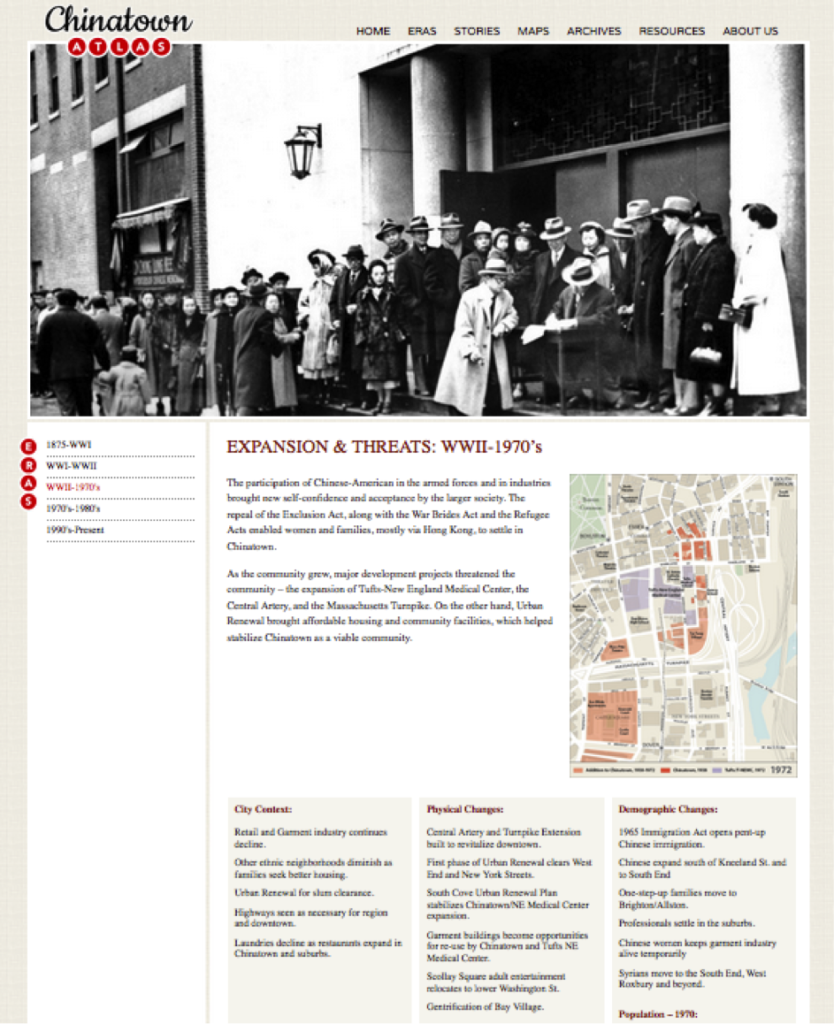
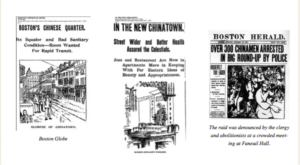
The Chinese were not welcome in the city and numerous efforts were made to remove them. Early efforts were street widenings, the location of the Elevated Railway, the mass arrest of suspected illegal immigrants and the growth of the garment industry. As the city grew, highway construction, the expansion of the Tufts Medical Center and urban renewal posed continuous threats to the viability of the community. More recently, the resurgence of downtown Boston has increased rents and land prices making it difficult for community businesses and low-income renters to stay in the area.
However, the community survived earlier threats through perseverance and ingenuity. Institutions such as family associations and language schools were founded to form the backbone of the community. It learned to protest and lobby against complete urban removal that had diminished or destroyed Chinatowns in cities like St. Louis or Washington, DC. At the same time, the city and the state became more committed to neighborhood concerns and public participation. As a result, the community-owned affordable housing and public facilities built with public help has enabled most low-income residents to stay.
The organization of the website. The components are the eras, essays about specific topics (e.g. garment district and community organizations) and personal stories. The eras are completed but the other sections are still in progress.
The eras as organizing principle. They are mostly defined by the changes in the immigration laws – Chinese Exclusion Act, the War Brides Act, the 1965 Immigration Act. Equally important is the context of the city and region.
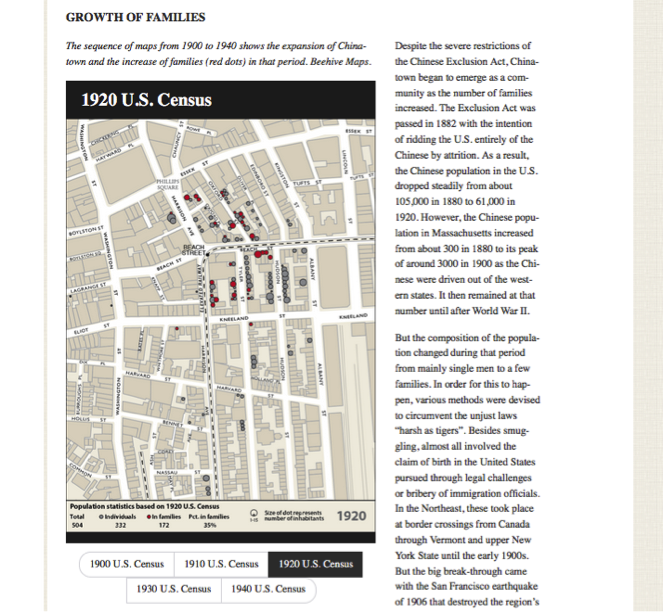
Maps on specific topics to help understand both the locational and social factors involve. E.g. although Chinatown was predominantly males of working age and called a “bachelor society” the analysis of the census shows the slow but clear growth of families from 1900 to WWII even under the Exclusion Act.
Articles from the historic Boston Globe. Given very sparse records and no memoirs, the digital files proved to be valuable resources for important events and daily life.
Photos from the Chinese Historical Society and archives (Boston Public Library, Historic Boston, Boston Globe etc.)
Focus on Boston is an on-going series curated by the Local Arrangements Committee to provide insight on and understanding of the geographies of Boston and New England. The 2017 AAG Annual Meeting will be held April 5-9, 2017, in Boston.
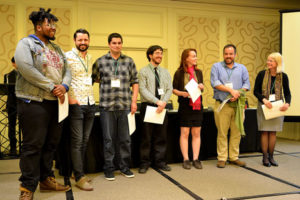
Southeast Division Team Takes 2016 World Geography Bowl Title
AAG President Sarah Bednarz (far right) presented prizes to winners, including the winning Southeast Division team above. (Photograph for AAG by Becky Pendergast)
The Southeast Division team won first place in the 2016 World Geography Bowl (WGB), an annual quiz competition for teams of college-level geography students representing the AAG’s regional divisions. First runner-up was the Pacific Coast Division team and second runner-up was the Middle Atlantic Division team. This was the 23rd year for AAG hosting during its annual meeting in San Francisco, Calif.
Contestants are selected by regional divisions via a competitive process, which in many divisions includes participation in a regional geography bowl held at the regional division’s annual meeting. Each participant in the World Geography Bowl receives a travel stipend, co-sponsored by the AAG and that student’s regional division, greatly offsetting expenses for attendance at the national meeting.
The competition is fully staffed by volunteers, who write and edit questions and help run the proceedings as judges, scorekeepers, and moderators. To become involved, read more about the process or contact WGB executive director Jamison Conley, (West Virginia U.) at Jamison [dot] Conley [at] mail [dot] wvu [dot] edu.
Anyone interested in becoming a sponsor or donating prizes of books, gift certificates, software, etc., may contact AAG’s WGB liason Ed Ferguson at eferguson [at] aag [dot] org.
Note: This post was edited to reflect that it was the 23rd annual event. A previous version erroneously stated it was the 27th annual event.
Share
Annual Meeting
AAG 2016 San Francisco Annual Meeting PDF Program
Share
Annual Meeting
AAG-Esri ConnectED GeoMentors Program Activities at the AAG Annual Meeting
Now in its second year, the AAG-Esri ConnectED GeoMentors Program will be featured at the AAG 2016 Annual Meeting in San Francisco. Attendees can learn more about the program, speak with program staff, and sign up to be a GeoMentor through program activities throughout the week. Follow @AAGGeoMentors on Twitter and use/search for #GeoMentors.
Visit the GeoMentors Program space, open all week near the conference registration area in the AAG booth, to find program materials, speak with program staff, and meet other GeoMentor volunteers! We would love the opportunity to meet current and future members of our community!
Attend the panel session featuring the GeoMentors program. All are encouraged to attend and learn about how to get involved, available resources, and current program achievements. The panel will also feature an open discussion about the program, including advice and insights from active GeoMentors. Panelists include AAG President Dr. Sarah Bednarz, Esri President and Founder Jack Dangermond, and members of Esri’s Education team, David DiBiase and Dr. Joseph Kerski.
Session: The AAG-Esri GeoMentors Program: Supporting GIS and Geography Education Thursday, March 31, 10:00 a.m. – 11:40 a.m.
Plaza A, Hilton Hotel, Lobby Level
Pick up your GeoMentor ribbon! Drop by the GeoMentors space (in the AAG booth near conference registration) to get your GeoMentor name badge ribbon to showcase your involvement in this important community. Not a GeoMentor yet? Register as a GeoMentor during the meeting and get a ribbon! This is a great way for GeoMentors to meet each other, network, and start new volunteer collaborations!
Talk to Esri staff about the ConnectED Initiative and GeoMentors program at the Esri booth in the exhibition hall.
Listen for GeoMentors program announcements in Geography Education & GIS sessions. Organizing or attending sessions whose audience might be interested in the GeoMentors program? Contact program staff at geomentors [at] aag [dot] org for a promo slide to display and come by the GeoMentors space for flyers to distribute at your session.
The AAG encourages its members to become a GeoMentor and help make a difference in improving GIS and geographic learning in schools (and you can get credit towards your GISP by volunteering as a GeoMentor!). Visit www.geomentors.net for more information, or sign up to be a GeoMentor directly at www.geomentors.net/participate.
As you head to San Francisco for the AAG with visions of the Golden Gate Bridge, colorful old street cars and steep sloped streets, consider exploring the wines of San Francisco. Although world-renowned Napa and Sonoma Valleys are a short drive north of San Pablo Bay, there are much more convenient options within San Francisco and nearby East Bay (Oakland, Berkeley and Alameda). Better yet, widespread public transportation provide worry free wine tasting. Called the “San Francisco Wine Train” by some, the “T” can take you to Bluxome Street Winery as well as Dogpatch Wine Works and Sutton Cellars, all found in old remodeled industrial spaces. (Jenn Pries, Weekly Dining 2014) Likewise the small family-owned East Bay Wineries are found in former factories, tanneries and one is even in an airline hanger! A trip on the Bay Area Rapid Transit (BART) can get you over to the East Bay in no time.
It may or may not surprise you that the United States is the biggest market for wine in the world, drinking 339 million cases of wine in 2013, ahead of France, Italy, Germany or China. On the other hand in terms of per capita, Italy is the leading consumer, followed by France, Switzerland and Portugal. (Will Lyons, Wall Street Journal 2015) Grape production in the United States has hovered around one million acres annually. Average yield 2008-2013 ranged from 7.3 to 8.7 tons per acre. This represents five million tons of grapes processed for wine in 2013 and an industry valued today in excess of 6 trillion dollars annually. (National Agricultural Statistics Service, NASS 2015) A lion’s share of this tonnage of wine grape production occurs in California. Leading varieties from the fall 2015 harvest include Chardonnay (16.4%), Cabernet Sauvignon (11.8%) and Zinfandel (10%). Thompson Seedless, grown for raisins, account for only 2%. (USDA Feb 2016 report).
The multiyear drought in California has taken a toll on overall volume of production and stiff international competition from places like New Zealand, Australia, Chile and Argentina has kept wine prices low. The 2015 crush of 3.86 million tons was down seven percent from the 2014 crush of 4.14 million tons. Price per ton was also down in 2015 with red wine grapes averaging $784 per ton and white wine grapes $667 per ton. Average price per ton overall was down ten percent year over year. (California Department of Food and Agriculture Feb 2016 report) Of course, this is a broad overview and price per ton varies spatially, depending on source region, vineyard reputation and proximity to buyers. This relates to the idea of terroir, that a particular location produces certain quality grapes because of soil, climate and other environmental factors. These environmental factors in combination with the skills of the winemaker yield certain flavor and quality in wine. Thus, the value of a ton of grapes varies dramatically from place to place … how very geographic!
The United States has a system for designating the geographic origin of the grapes in wine provided at least 85 percent of the grapes used in the wine comes from that geographic region. The Appellation of Origin may designate a county or state of origin or may use a federally approved growing region called American Viticultural Area (AVA). As of March 3, 2016 there are 234 AVAs in the USA, of which 138 are in California. (Alcohol and Tobacco Tax and Trade Bureau, U.S. Department of the Treasury March 2016) San Francisco AVA is large, 1.5 million acres, and includes the counties of Alameda, Contra Costa, Santa Clara, San Francisco and San Mateo as well as parts of Santa Cruz and San Benito Counties. Smaller AVAs are nested within the San Francisco AVA (Livermore Valley, Pacheco Pass, Lamorinda, San Ysidro District and Santa Clara Valley). Pacheco Pass and Lamorinda were just created in March 2016. AVAs are constantly being subdivided into smaller AVAs and, as well, completely new areas are applying for and receiving approval. In California since 2014 there have been 21 new AVAs, more than half in San Luis Obispo County. Most are in the south or central coast region of the state. Exceptions include Fountaingrove District (2015) in Sonoma County and Manton Valley (2014) which straddles Shasta and Tehama County near Lassen Volcanic National Park. If you have time and are up for a road trip north of San Francisco, I recommend the less visited Manton Valley AVA which has six wineries and the bonus of nearby beautiful Mount Lassen.
If you are more interested in staying in San Francisco and drinking some wine at an urban winery with a view, check out this list. Below are rankings of the ten highest rated wineries with a view in San Francisco. (Yelp March 2016)
HIGHEST RATED WINERIES WITH A SF VIEW
Neighborhood
Telephone
1
SAN FRANCISCO MEAD CO, 1180 Shafter Ave
Bayview-Hunters Point
(415) 819-4941
2
BLUXOME STREET WINERY, 53 Bluxome St.
SoMa
(415) 543-5353
3
WATTLE CREEK WINERY, 900 N. Point St
Fisherman’s Wharf
(415) 359-1206
4
JAX VINEYARDS, 326 Brannon St
SoMa
(415) 446-9505
5
SOL ROUGE WINERY, 400 California Ave
Treasure Island
(415) 756-2254
6
SOTTOMARINO WINERY, 400 California Ave
Treasure Island
(415) 967-4200
7
WINERY COLLECTIVE, 485 Jefferson St
Fisherman’s Wharf
(415) 929-9463
8
THE WINERY SF, 200 California Ave
Treasure Island
(415) 735-8423
OTHER HIGHLY RATED WINERIES IN SF
Neighborhood
Telephone
1
TANK18, 1345 Howard St
SoMa
No phone given
2
DOGPATCH WINEWORKS, 2455 3rd St
Dogpatch
(415) 525-4440
3
SUTTON CELLARS, 601 22nd St.
Dogpatch
No phone given
4
SAN FRANCISCO WINE TRADING, 250 Taraval St
West Portal
(415) 819-4941
5
GOLDEN GATE WINE CELLAR, 2337 Ocean Ave
Ingleside Terraces
(415) 337-4083
In addition to the above urban wineries where grapes are purchased and wine produced and aged, there are also simply wine bars where you can sample a variety of wines, have appetizers and perhaps a meal. Below are rankings of the ten most reviewed San Francisco wine bars, the ten highest rated San Francisco wine bars and the ten San Francisco wine bars that are reported as good for groups. (Yelp March 2016)
10 MOST REVIEWED San Francisco Wine Bars
Food Style
Telephone
1
RN74, 301 Mission St
American
(415) 543-7474
2
AMELIE, 1754 Polk St
French
(415) 292-6916
3
PRESS CLUB, 20 Yerba Buena Ln
Mixed
(415) 744-5000
4
DISTRICT SAN FRANCISCO, 216 Townsend St
also Brunch
(415) 896-2120
5
FIRST CRUSH, 101 Cyril Magnin St
American
(628) 400-5998
6
LOCAL KITCHEN & WINE, 330 1st St
American
(415) 777-4200
7
HIDDEN VINE, 408 Merchant St
Mixed
(415) 674-3567
8
BLACKBIRD, 2124 Market St
Bar
(415) 503-0630
9
PAULINE’S PIZZA & WINE, 260 Valencia St
Pizza
(415) 552-2050
10
THE RICHMOND, 615 Balboa St
American
(415) 379-8988
10 HIGHEST RATED San Francisco Wine Bars
Neighborhood
1
ROBBERBARON, 2032 Polk St
Nob Hill
(415) 516-6945
2
HIDDEN VINE, 408 Merchant St
Financial
(415) 674-3567
3
ENO WINE BAR, 320 Geary St
Union Square
(415) 678-5321
4
RESOLUTE, 678 Geary St
Lower Nob Hill
(415) 825-0741
5
THE RICHMOND, 615 Balboa St
Inner Richmond
(415) 379-8988
6
VIN DEBUT, 9 West Portal Ave
West Portal
(415) 987-0414
7
YIELD WINE BAR, 2490 3rd St
Dogpatch
(415) 401-8984
8
20 SPOT, 3565 20TH St.
Mission
(415) 624-3140
9
BLUXOME STREET WINERY, 53 Bluxome St
SoMa
(415) 543-5353
10
AMELIE, 1754 Polk St
Nob Hill
(415) 292-6916
San Francisco Wine Bars GOOD FOR GROUPS
Neighborhood
1
HIGH TREASON, 443 Clement ST
Inner Richmond
(415) 555-1212
2
HIDDEN VINE, 408 Merchant St
Financial
(415) 674-3567
3
ETCETERA WINE BAR, 795 Valencia St
Mission
(415) 926-5477
4
RESOLUTE, 678 Geary St
Lower Nob Hill
(415) 825-0741
5
ENO WINE BAR, 320 Geary St
Union Square
(415) 678-5321
6
L’EMIGRANTE WINE BAR, 2199 Mission St
Mission
(415) 863-4777
7
INNER FOG, 545 Irving St
Inner Sunset
(415) 682-4116
8
20 SPOT, 3565 20TH St.
Mission
(415) 624-3140
9
INTERNOS WINE CAFÉ, 3240 Geary Blvd
Laurel Heights
(415) 751-2661
10
TOFINO WINES, 2696 Geary Blvd
Laurel Heights
(415) 872-5782
Cheers and bon appétit. …
Betty Elaine Smith, Professor
Department of Geology and Geography
Eastern Illinois University
Carry the AAG 2016 Annual Meeting Program in Your Pocket
Get the most from your AAG 2016 San Francisco experience with the mobile app. Enjoy an interactive experience on your Apple, Android, BlackBerry and other mobile devices during AAG 2016 in San Francisco. If you’re a laptop user or have a Windows phone, there’s also a Web version for your devices.
Plan your experience throughout the meeting:
search sessions by day, group or type or just browse the abstracts and participants listings
create your own calendar of events by adding your favorite sessions to your schedule
receive updated changes to sessions and events from organizers
browse exhibitor listings
take notes during sessions and send as emails and also rate the sessions
view the list of local restaurants to experience during your visit
locate various sessions by tapping on areas of each floor plan within the maps icon
The app will help you balance your schedule of preferred sessions, events and meetings with friends and colleagues, while keeping you informed with daily Geograms and social media updates. Networking features offer colleagues tools to share schedules and exchange contact information. The AAG mobile app also integrates with social media networks on Twitter, Facebook, and LinkedIn. And, it will help you collect and share important notes and information from sessions and exhibitors.
IMPORTANT NOTES: If you plan to use the app on two of your mobile devices, it’s important to set up the multi-device sync within the app on both devices. (See tip sheet for more details.)
Also, if you find the app is slow to launch, you may bypass the update by simply tapping the back arrow on Android or the cancel button on iOS devices to immediately get to the dashboard. Update times during app launch vary by device, connection strength and also depend on when you last did a full update. Remember, this is a large meeting with 6,600 abstracts, 1,700 sessions and 8,500 attendees! Make sure you try to update at least once a day to capture any changes, such as session updates, newly added attendees, etc. If your refresh button turns red, it’s time to update.
Share
Post
NCRGE to Discuss Funding Opportunities, Sponsor Sessions at AAG Annual Meeting
The National Center for Research in Geography Education (NCRGE) is sponsoring several sessions at the 2016 AAG Annual Meeting in San Francisco. Papers and panels will highlight the work of the GeoCapabilities, GeoSTEM and GeoProgressions projects. A new funding opportunity for geography education research will also be discussed.
The full schedule of NCRGE-sponsored sessions is available on the NCRGE website.
Share
Annual Meeting
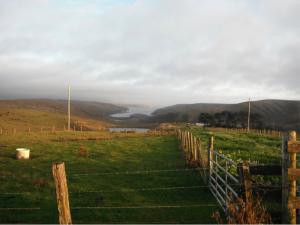
Point Reyes National Seashore: A Brief History of a Working Landscape
A working landscape of Point Reyes National Seashore.
Just a mere forty windy miles north of San Francisco is a popular natural wonder. Point Reyes National Seashore and the Phillip Burton Wilderness Area are prime destinations for visitors near and far. While many visit these places to fulfill their quest to get away from the hustle and bustle of the nearby city life and commune with the natural landscapes, some folks get to call the seashore home. Point Reyes National Seashore is a working landscape, containing dairies and ranches that have been in place for generations. However, with mixed use comes disagreement over the proper use of the space and discussions on the purpose of national park system units.
Long before Point Reyes became a National Seashore and a site for controversy, it was home to the Coast Miwok tribes. Living on the Point Reyes peninsula for centuries, the Coast Miwok found their lives uprooted when they were relocated to nearby Missions in the late 1700s to early 1800s (DeRooy and Livingston 2008). After the Coast Miwoks’ expulsion, Mexican rancheros grazed cattle on the land during the 1830s. When California became part of the United States in 1850, the land was divided by the owners into 32 tenant-run diaries and cattle ranches to keep up with the demand from the urban centers of the San Francisco Bay (Watt 2002; Deur and Mark 2011). World War II even brought mining and military installations to this future “untrammeled” wilderness area.A great deal of the current contention lies around the fundamental issue of working landscapes as park land. While it may be controversial, the presence of grazing on the land at Point Reyes National Seashore has provided a number of ecological benefits, such as a greater number and variety of native grasses as compared to areas that have suffered shrub invasion where grazing was removed (Rilla and Bush 2009). In recent years there have been a number of issues at Point Reyes that have escalated controversy and caused a fracturing between the tenants at Point Reyes National Seashore, the National Park Service, park visitors and environmental groups. Some of the recent issues causing tension include the removal of Drakes Bay Oyster Company from the park, ranchers being denied renewal of their leases at the seashore, Tule elk competing with ranchers’ cattle herds, and an outdated general management plan. However, despite the disputes over the landscape that have been building in the last few years, the parties all agree that Point Reyes is unique place worthy of protection.
After studying the area since the 1930s as a potential location for a public recreational area to serve the residents of the growing city of San Francisco, in 1962 in an attempt to stave off a potential housing development, the National Park Service decided to establish the Point Reyes National Seashore (PRNS) as a 53,000 acre recreational area, including a 21,000 acre pastoral zone, located on the Point Reyes Peninsula in Marin County, California. In 1976 an additional 25,370 acres were designated as the Phillip Burton Wilderness Area at Point Reyes National Seashore. Within the PRNS and wilderness area 8,003 acres were designated as potential wilderness additions. Today PRNS is a 71,028 acre park preserve. As previously mentioned, Point Reyes has continued to be an area of mixed use between commercial and recreational activities, allowing for some agricultural uses to continue on the protected lands.[1] As noted by Deur and Mark, “The continued operations of dairies and ranches became an integral part of the park, and the NPS found itself having to work with ranchers directly as neighbor and often owner. When the NPS carried out purchases of ranch land, it usually granted reservations of use and occupancy for a period of 25 years to those who wished to continue ranching” (Deur and Mark 2011). Although these uses were allowed to remain, they were not without restrictions and remained exceptions, giving less power and control those who worked the land.
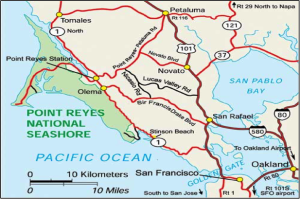
Map displaying the location of Point Reyes National Seashore (Point Reyes Getaways, 2015).
In a report on resident communities in national parks, Douglas Deur, University of Washington researcher, and Stephen R. Mark, NPS Historian, note the balancing act that the NPS has been conducting over the years between the expectations of a pristine landscape by park visitors and the need to respect the communities that reside in and help shape the parkland. In reviewing four case studies for the management of agriculture in national parks, Deur and Mark point to Point Reyes National Seashore as an “outstanding example” of a thriving mixture of agriculture and parkland. However, the authors state, “…as landlord at Point Reyes, the NPS continues to be challenged by the complexities inherent with maintaining economically viable ranch operations within a recreation area where visitors see natural values as predominant. Many of the ranchers have nevertheless viewed the NPS presence as beneficial, since the peninsula also represents the only large block of land in Marin County remaining in agricultural production”(Deur and Mark 2011). Deur and Mark conclude with describing Point Reyes as an experiment of sorts between a combination of private and public uses in order to please the multiple stakeholders.The 1964 Wilderness Act, that was used to establish the Phillip Burton Wilderness Area at Point Reyes National Seashore in 1976, envisioned wilderness as an, “…area where the earth and its community of life are untrammeled by man, where man himself is a visitor who does not remain…without permanent improvements or human habitation, which is protected and managed so as to preserve its natural conditions…” (Public Law 88-577). While this was the vision of wilderness seen through the eyes of Wilderness Society’s Howard Zahniser, the author of the Act, the Act also contained many exceptions, such as non-conforming prior uses. Point Reyes never quite fit the ideal model of a wilderness area, as it was the first area to receive the designation of potential wilderness lands. While the NPS may have a history of accepting alternative uses within the park land at Point Reyes, it appears with recent tensions and decisions that they are headed down the traditional path of park management, one that excludes people, other than tourists, from their vision.
Environmental historian, Laura A. Watt, has been researching the case of Point Reyes National Seashore for over a decade. She has written a number of articles on Point Reyes and has a forthcoming book on the subject, The Paradox of Preservation: Wilderness and Working Landscapes at PointReyes National Seashore. Watt’s work explores the controversy over Drakes Bay Oyster Company[2] through the lens of preservation and the ideas that surround what a park ‘ought’ to be. In order to understand the progression of issues at Point Reyes, Watt reviews the ideology that underpins the historical development of the National Park Service and the United States’ ideals of park land and the effect these ideals have had on the establishment and management of PRNS.
Point Reyes is a particularly distinctive unit in the U.S national park system, comprised of both a wilderness area and working landscapes as park land. While the disputes over the space have been increasing recently, much of the root of the tension lies in the designation of the space. The National Park Service has the challenging mission of both protecting the space while also providing for the enjoyment of the visitors and overseeing the commercial uses of the protected land. They have often chosen in the past to view society as separate from nature, fostering the perception that the two are incompatible, and thus dictating who is allowed access to a particular resource. In her article, “The Trouble with Preservation, or, Getting Back to the Wrong Term for Wilderness Protection: A Case Study at Point Reyes National Seashore”, Laura Watt provides several propositions to help counteract the myth of wilderness as separate from that of human use. She proposes the use of a continuum of standards for wilderness determined by the degree to which the area has been inhabited and people have manipulated the land, rather than an all or nothing approach, a sentiment shared by William Cronon (Cronon 1996). Watt also suggests that, “the NPS and other land management agencies could help to heal this disconnect between nature and culture by encouraging the public to understand the human history of natural areas, even while continuing to manage wilderness values”(Watt 2002). Nevertheless, the decisions of who is allowed access, and of what type, in a conserved space can have profound impacts not only on the visitors to the space, but on the residents that depended on that space for their livelihoods.
References
Cronon, William. 1996. “The Trouble with Wilderness; Or, Getting Back to the Wrong Nature.” In Uncommon Ground: Rethinking the Human Place in Nature, edited by William Cronon, 69–90. New York/London: W.W. Norton and Company.
DeRooy, Carola, and Dewey Livingston. 2008. Point Reyes Peninsula: Olema, Point Reyes Station, and Iverness. San Francisco: Arcadia Publishing.
Deur, Douglas, and Stephen R Mark. 2011. Resident Communities and Agriculture in National Parks : An Assessment and Prospectus.
Rilla, Ellie, and Lisa Bush. 2009. The Changing Role of Agriculture in Point Reyes National Seashore. Novato. https://ucanr.org/sites/uccemarin/files/31000.pdf.
Watt, Laura A. 2002. “The Trouble with Preservation, Or, Getting Back to the Wrong Term for Wilderness Protection: A Case Study at Point Reyes National Seashore.” APCG Yearbook 64: 55–77.
Notes
[1]. For further detail on the acts establishing PRNS and the Wilderness area, see Laura A.Watt’s
forthcoming book, The Paradox of Preservation: Wilderness and Working Landscapes at Point Reyes National Seashore.
[2]. The Drakes Bay Oyster Company controversy involves the issue of whether or not the Department of the Interior would reinstate the company’s lease to commercially harvest oysters at PRNS. The decision was made to expel Drakes Bay Oyster Company from the park in December 2014. While outside the scope of this paper, this is a fascinating case that can be explored further in Laura A. Watt’s forthcoming book, The Paradox of Preservation: Wilderness and Working Landscapes at Point Reyes National Seashore.
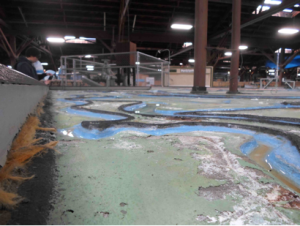
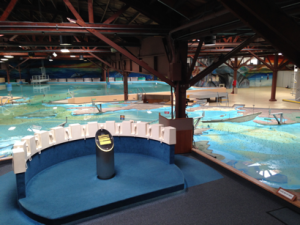
When geographers touch down in San Francisco this spring, they will encounter a socio-natural world produced in part through technical efforts to understand and manage it. As a primary means by which such efforts were pursued in the Bay Area during the postwar years, the San Francisco Bay-Delta Hydraulic Model – located a few miles north of the city in the town of Sausalito – offers a unique window into the formation of the metropolitan region. Built by the Army Corps of Engineers to simulate bay-estuary conditions and test the feasibility of development plans, the physical model now operates as an educational center and public showcase for the accomplishments of the Corps. Spread out over an acre in a former military shipbuilding warehouse and composed of hundreds of 12’ by 12’ concrete slabs, the model also constitutes a richly layered if seemingly anachronistic world onto itself. Passing through the Bay Model Visitor Center means confronting a vast terrain of miniature canals and levees, dikes and bridges, rivers and bays, and technical instruments and appurtenances that collectively target the bay and its watershed. Above the ebb and flow of the model’s mechanized tide, the whir of electric devices punctures the damp stillness of the air. Below it, rust steadily creeps throughout a labyrinth of channels. A landscape to traverse as much as a view to behold, the Bay Model promises to lend unique perspective on the world beyond the walls that house it.
Model Diagram. From McLeod and McLeod, 1983.
At the turn of the millennium, rendered obsolete by advances in computer modeling, the Bay Model ceased operating in any official research capacity. Over its four-decade working life, however, the model generated important new understandings about the San Francisco Bay and Sacramento-San Joaquin Delta as “a complex estuarine system” (USACE 1993). To meet the needs of comprehensive planning, the Corps undertook an extensive survey of the Bay Area and constructed the replica landscape between 1956 and 1957 at a horizontal scale of 1:1,000 and a vertical one of 1:100. Originally encompassing a swath of the Pacific and the entire bay-estuary to the confluence of the Sacramento and San Joaquin rivers, the tool was designed to reproduce an average tidal cycle at a timescale of 14.9 minutes. But before it could be used to either simulate circulation patterns or forecast the effects of various reclamation and barrier proposals – such as the infamous Reber Plan to dam the bay (Wollenberg 2015) – the model had to be verified to known prototype conditions through a series of infrastructural interventions and measurements in the field. With the construction of the delta addition in the late 1960s, the model was mobilized to study the impact of dredging, channel realignment, and fresh-water diversion – still a source of conflict in California – on salinity intrusion and water quality. While running simulations initially required a team of seventy technicians to perform an intricate choreography of measurement and calculation, ongoing processes of instrumentation and the establishment of computerized control and data acquisition systems later allowed for greater operational flexibility. Today the model’s test-bed embodies the sedimentation of over forty years of technical practice.
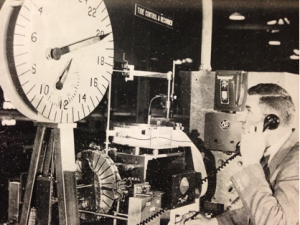
Tide Generator at the Bay Model. From USACE, 1963.
As an engineering and planning tool, the Bay Model produced a number of effects that continue to animate political life the Bay Area. Most notably, it constituted the bay-delta system as an object of sustained inquiry and fixed the region as an appropriate scale of environmental management and administration. As early as 1967, Eugene Huggins and Edward Schultz of the San Francisco Army Engineer District pointed to the model as a primary means by which such realignments were achieved. On the one hand, they argued that simulations run on the model produced “the finest and most comprehensive library of data on the action and environment of the Bay now in existence” and provided “the foundation for almost all regional planning, by practically all agencies, in the Bay Area.” By offering a framework with which to probe the impact of individual projects on the bay-estuary and delta as a whole, the model, in their view, girded a broader scientific and popular shift in conceptions of the San Francisco Bay as an interconnected ecological system. Tellingly, data about the bay-delta system generated on the physical model, programmed into computers, continues to inform contemporary modeling exercises. On the other hand, in highlighting the intertwined fate of different Bay Area communities at the scale of nature, Huggins and Schultz suggested that the information produced on the model proved to be a “major stimulant…for the formation of regional authorities.” Indeed, the Bay Conservation and Development Commission, the Association of Bay Area Governments, and the Bay Area Council, among other regional organizations that guide development and promote policy in the Bay Area today, all drew upon studies conducted at the Bay Model and the expertise of the Corps more generally to support their institutional formation and governance agendas.
The Mississippi River Basin Model. Photo: John Elrick.
While the San Francisco Bay Model was but one of several large-scale hydraulic models built by the Corps of Engineers, it is the only one actively maintained. The outlines of Maryland’s Chesapeake Bay Model, opened in 1970s before rapidly falling into disuse and decay, might be gleaned from satellite images today. Likewise, the ruins of the massive Mississippi River Basin Model, itself a feat of engineering that targeted the Mississippi River and its major tributaries, can still be found in Clinton, Mississippi. Approved in 1943 and constructed with technical assistance from the Waterways Experiment Station and POW labor, the Basin Model – the ‘ur-model’ of the Corps’ mid-century hydraulic engineering program – embodied an important shift in approaches to water management. The Flood Control Act of 1936 charged the Corps with developing a more comprehensive solution to inundation than earlier piecemeal efforts to control individual rivers. “To understand the Mississippi River Basin as a dynamic system of interconnected waterways,” Kristi Dykema Cheramie suggests in an insightful essay, “the Corps needed new, more sophisticated tools” (2011). After successfully predicting the extent and impact of flooding in 1952, the test-bed was vindicated as a forecasting tool and mobilized to simulate flows throughout the watershed as a system. “The model,” Cheramie argues, “allowed the Mississippi River Basin to become, for the purposes of study, an object, a manageable site.” Like the San Francisco Bay Model, it promoted “a new scale of thinking” and demonstrated “the power of visualizations to shape policy through design.” With the development of “computational scripting and planning analysis technologies” in the 1970s, however, the Basin Model was “gradually upstaged by a mainframe computer in Sacramento.” In the 1990s, the Corps abandoned the model altogether, leaving it to be reclaimed by a pine forest.
The Bay Model from on high. Photo: John Elrick.
A combination of factors helps account for the preservation of the San Francisco Bay Model as well as its relative longevity as a research tool. First, unlike the Mississippi River Basin Model, the Bay Model’s test-bed was built upon a network of adjustable jacks in anticipation of seismic disturbances, allowing it to be continually re-calibrated to the shifting topography of the bay. The capacity to tune the model to fit changing conditions, combined with the fact that it remained sheltered within a controlled environment able to accommodate innovations, fostered the formation of a community of engineers willing to advocate for its continued relevance into the 1990s (Sinclaire 2011). Second, and perhaps most importantly, under the stewardship of William Angeloni, the model secured “Operation and Maintenance” funding in 1980. Rather than continuing to seek out financial support from project to project, federal apportionment gave the Bay Model stability as a site. Finally, while this funding provided for both the establishment of the Visitor Center and the facility’s eventual transformation into a tourist attraction, the model – from its inception – was understood to serve a pedagogical function. Built on location due to widespread enthusiasm for the project, it opened to ceremonious fanfare as a demonstration site where the public could learn about “the needs of a balanced ecology” and “hard data” might temper contentious debates over development and water policy (Huggins and Schultz 1967; Weisberg 2013). The model soon became – and still is – a regular stop on the school field-trip circuit. Yet, as Javier Arbona points out, both the aesthetic qualities of the model and the layout of its facility underwent subtle but important changes after 2000. Though framed today as an educational complex highlighting the region’s ecology and the importance of water conservation, the Visitor Center – with the model as its crown jewel – might just as well be understood as “a monument to the Army Corps” itself (Arbona and Woebken 2015).
The Angel of History at Richardson Bay. Photo: John Elrick.
Despite the new layers of paint, the framing devices, and the addition of an observation deck designed to render the structure legible, visiting the model today can still leave one feeling overwhelmed. Indeed, it’s not uncommon to spot marauding bands of children and their adult counterparts hurry past exhibits on natural history and WWII-era shipbuilding only to lose themselves within the abstract landscape of concrete bays and sculpted channels. While the model’s size, shape, and distorted scale combine to produce a sense of disorientation, its character as a relic or technological artifact of some bygone era bolsters this impression. It’s almost as though the model – a mere stone’s throw from the global epicenter of ‘disruptive innovation’ – got swept up in the storm of progress and dumped on shores of Richardson Bay in Sausalito. There’s something fitting, poignant even, about the un-timeliness of the model. After all, upon stepping out of the warehouse, one of the first things to confront visitors is a heaping mountain of wreckage. The Corps continues to run its “floating debris hazard collection” operations out of the Sausalito Base Yard, and it regularly deploys patrols to search for driftwood, sunken vessels, and rotting piers that might hinder navigation. Around ninety tons of detritus is pulled from the bay each month and loaded onto a dock in front of the Bay Model. There it sits, waiting to be trucked offsite for disposal. For the San Francisco District of the Army Corps of Engineers, progress literally entails the piling up of debris.
John Elrick is a PhD candidate at UC Berkeley. The Bay Model is located at 2100 Bridgeway, Sausalito, CA 94965. Additional information about the Bay Model Visitor Center can be found on its website.
US Army Corps of Engineers, San Francisco District, Comprehensive Survey of the San Francisco Bay and Tributaries, California. Appendix ‘H,’ Hydraulic Model Studies to the Interim Report on San Francisco Bay Barriers, Volume I of III (Figure 8). US Government Printing Office, March 1963.
US Army Corps of Engineers, San Francisco District, San Francisco Bay-Delta Tidal Hydraulic Model User’s Manual. US Government Printing Office, 1993.
With large-scale demand and a mission to protect public health, hospitals are emerging as the next frontier of the sustainable food movement. Health care institutions spend $12 billion in the food and beverage sector each year,1 and a single hospital can have an annual food budget of $1–7 million or more.2 Even small shifts in foodservice budgets can create new markets for alternative foods.
To date, the darlings of the food movement have been farmers’ markets, Community Supported Agriculture (CSA) programs, and urban farms that connect eaters directly with the source of their food. These models appear to have boosted the number of small farmers in the U.S. after decades of freefall,3 but research shows that we now have an increasingly bifurcated system that favors small-scale direct markets and large-scale commodity markets. What’s more, experts believe that direct market models are reaching a saturation point even though they’ve barely begun to scratch the surface of the agricultural status quo. Local food sales account for less than two percent of total farm gross, and the goods exchanging hands at some 7,800 farmers’ markets nationwide represent less than one percent of total U.S. agricultural production.4
Meanwhile, mid-sized family farmers are being squeezed out by the march of consolidation within the food system, as are independent middlemen that aggregate, process, and distribute food regionally.5 This agriculture of the middle, meaning mid-sized family farmers and mid-level food system intermediaries, represents the most threatened set of entities in the agricultural sector. Direct market models hold little sway in solving this problem, they are too small to support mid-sized farmers, and they purposefully cut out middlemen.
Leading-edge food system advocates are looking to institutional buyers like hospitals, schools, and universities to help rebuild this missing middle ground because they buy in large volumes and they rely on the wholesalers, processors, and distributors that make up the functional infrastructure of the U.S. food system. But the leap in scale from an individual buying three onions at a farmers’ market to a hospital buying three hundred cases is not simply one of numbers, it presents an entirely different set of challenges, opportunities, and relationships. When you’re making soup for six hundred, changing your grocery list quickly gets complicated.
A team of San Francisco Bay Area hospitals have been at the vanguard of this institutional food revolution since 2005. Leaders including Kaiser Permanente, University of California at San Francisco Medical Center, John Muir Health, and the San Francisco VA Medical Center, gathered at the FoodMed Conference in Oakland, California that year. A non-profit organization called Health Care Without Harm convened leaders from the sustainable agriculture, environmental health, public health, and health care sectors to discuss their overlapping concerns and goals. Together, they articulated a systemic environmental nutrition approach to healthy food, going beyond counting calories and balancing food groups to address the many ways the food system impacts public health.
Since then, over 550 hospitals nationwide, they have signed a Healthy Food in Health Care Pledge generated by the nonprofit coalition Health Care Without Harm (HCWH) which states that “for the consumers who eat it, the workers who produce it and the ecosystems that sustain us, healthy food must be defined not only by nutritional quality, but equally by a food system that is economically viable, environmentally sustainable, and supportive of human dignity and justice.”
Hospitals are putting this vision into practice by serving local produce when it’s in season, switching to rBGH-free dairy products, and sourcing seafood from community-based fisheries. They are buying fair trade coffee, cage-free eggs, and organic salad greens. Some are reducing meat servings to lower their greenhouse gas footprint and are using the cost savings to buy grass-fed beef and free-range chicken raised without antibiotics or added hormones.
“Local, organic chicken was a real challenge” says one leading Bay Area Hospital Food and Nutrition Services Director. Under the current system, he can place an order on his food distributor’s website, and the next day hundreds of uniform 4-ounce chicken breasts show up on his loading dock, shrink-wrapped and stacked by the case. Procuring local, organic chicken first required weeks of working through bureaucratic purchasing and legal systems to set up a new vendor relationship. When the hospital finally received its first delivery, it was an ice-packed box of whole chickens with the heads and feet still on. “My cooks almost died,” he reports. Having to chop off chicken heads is a far cry from lining up a row of boneless, skinless meat parts in the griller. Most institutional kitchens no longer have the equipment or staff with the knowledge necessary to deal with whole foods.
The pallets of uniform poultry parts that come through national distributors like Sysco and US Foods also help hospitals to meet strict federal dietary guidelines, as each cut arrives within a fraction of the weight ordered. In contrast, locally-sourced chicken breasts, even if they arrive pre-processed, might come in a four to eight ounce range, forcing staff to slice and individually weigh servings. With tight budgets, paying staff to mete out perfect portions may not be time that a hospital foodservice department can afford.
Efficiency has been a dirty word in some food movement circles, but a little efficiency goes a long way when you’re serving hundreds to thousands of meals every day. Equally blasphemous has been middlemen. But buying food at the institutional scale means relying on certain industrial-style standards and relationships. Hospitals are a microcosm of the challenges that face the alternative food movement as it seeks to scale up — they need to balance their sustainable food goals with their need for efficiency and affordability.
Initiatives like the Farm Fresh Healthcare Project offer insight into how leading hospitals are working with distributors to retrofit existing supply chains to become shorter, more flexible, and more transparent. Since 2011, a team of hospitals in the San Francisco Bay Area have partnered with Health Care Without Harm and Community Alliance with Family Farmers to source more local and organic produce from family farmers.
Beyond purchasing power, hospitals can leverage another form of currency in support of organic agriculture – moral authority. Polls consistently show that health professionals rank as some of the most trusted experts in the United States. [1] They can “tell stories about great farmers,” as Luis Vargas, Procurement Manager for Nutrition and Food Services at University of San Francisco Medical Center says, “People look to us for this leadership, and we should be showing the way.” Like the first hospitals to ban smoking on their grounds, which led to greater public awareness and smoking restrictions in other locations,6 those that are leading the environmental nutrition movement are enacting changes that will have ripple effects throughout society.
AAG Members get exclusive access to publications, prominent journals, unique advocacy, grant, scholarship and professional opportunities with access to industry focus communities, and event discounts, including our annual meeting.
Some content may only be accessible if you belong to specific Specialty or Affinity Groups. You can still update your membership below. You will need to go through the Join flow, but you do not need to repurchase your membership unless it is expired or about to expire.
To provide the best experiences, we use technologies like cookies to store and/or access device information. Consenting to these technologies will allow us to process data such as browsing behavior or unique IDs on this site. Not consenting or withdrawing consent, may adversely affect certain features and functions.
Functional
Always active
The technical storage or access is strictly necessary for the legitimate purpose of enabling the use of a specific service explicitly requested by the subscriber or user, or for the sole purpose of carrying out the transmission of a communication over an electronic communications network.
Preferences
The technical storage or access is necessary for the legitimate purpose of storing preferences that are not requested by the subscriber or user.
Statistics
The technical storage or access that is used exclusively for statistical purposes.The technical storage or access that is used exclusively for anonymous statistical purposes. Without a subpoena, voluntary compliance on the part of your Internet Service Provider, or additional records from a third party, information stored or retrieved for this purpose alone cannot usually be used to identify you.
Marketing
The technical storage or access is required to create user profiles to send advertising, or to track the user on a website or across several websites for similar marketing purposes.

 Pick up your GeoMentor ribbon! Drop by the GeoMentors space (in the AAG booth near conference registration) to get your GeoMentor name badge ribbon to showcase your involvement in this important community. Not a GeoMentor yet? Register as a GeoMentor during the meeting and get a ribbon! This is a great way for GeoMentors to meet each other, network, and start new volunteer collaborations!
 Get the most from your AAG 2016 San Francisco experience with the mobile app. Enjoy an interactive experience on your Apple, Android, BlackBerry and other mobile devices during AAG 2016 in San Francisco. If you’re a laptop user or have a Windows phone, there’s also a Web version for your devices.