Tracking the Geography of Diseases: How Epidemiologists Map Infection
![]() Geography in the News is an educational series offered by the American Association of Geographers for teachers and students in all subjects. We include vocabulary, discussion, and assignment ideas at the end of each article.
Geography in the News is an educational series offered by the American Association of Geographers for teachers and students in all subjects. We include vocabulary, discussion, and assignment ideas at the end of each article.
By Neal Lineback
Have you ever wondered where you caught a cold? If so, you’ve asked the first question epidemologists ask about infectious diseases. Epidemiology is the study of how diseases spread. It relies on geography to find its answers.
You could say that epidemiologists study the “where” of diseases. Specifically, they study the paths of communicable diseases.
What are communicable diseases? They’re the ones you can catch. These illnesses spread through viruses, fungi, or bacteria, typically from person to person, and sometimes from animals to people. Some diseases come from contaminated food, water, or insects. All of these transmissions relate to geography.
Viruses and bacteria are all around us, particularly in dense human populations. Some are harmless. But dangerous viruses range across a whole host of diseases, from pneumonia and whooping cough to measles, chicken pox, and polio, among others.
Among the least dangerous to healthy individuals is the common cold, or Rhinovirus. Its symptoms are normally mild. The cold is so common that it’s almost impossible to know where you caught it—unless you are an epidemologist. Through contact tracing, distribution maps, and other tools, epidemiologists can find the initial source of an infection. It takes only one or two people for a disease to spread as contacts multiply.
Epidemiology is a science of time as well as space. Once a few people show symptoms, they could infect 50 percent or more of the people they come in contact with, within three to ten days. This makes swift analysis crucial.
A fast-moving virus can cause an epidemic or pandemic. The difference between the two is in distribution. The disease is distributed unevenly in an epidemic, with some communities having few or no cases. In a pandemic, many more people are sick across more areas. Deaths and hospitalizations are elevated too.
This is why the flu virus—which is actually a number of virus types that can mutate over time–and the COVID viruses are carefully tracked by their strain. Flu is also identified by type. If you have ever heard a strain of influenza referred to as A,B,C, or D, you have heard its type, based on its severity. “A” causes pandemics and is the most dangerous. “B” can cause epidemics. “C” causes mild cold-like symptoms. “D” is an animal variety.
The recent COVID outbreak in 2020-2023 was a pandemic in the United States. Ensheng Dong, a Ph.D. student at Johns Hopkins University, was one of the first people in the world to create a map-based dashboard to show the disease’s spread. Using a Geographic Information System (GIS), Dong worked with physicists, geographers, and others at the university to build a map to track outbreaks. Its red-on-black appearance became iconic.
Outbreaks of many viral infections can be mapped. The CDC (Centers of Disease Control) and other international medical institutions maintain huge geographical databases to follow outbreaks around the world. This research is critical in slowing, treating, and containing viral diffusions and concentrations, allowing the medical professionals to predict where intervention (ie. tests, warnings, and vaccinations) can be helpful in reducing deaths and hospitalizations.
Epidemiology is still a young science. Less than 175 years ago, a doctor named John Snow identified the source of the 1854 cholera outbreak in London: a neighborhood water pump. He did this by mapping all of the cholera cases in the area and interviewing the families. Once he identified the common location they’d used to draw water, he removed the handle from the pump. New cases fell.
This map shows the 2013 spread of polio worldwide:
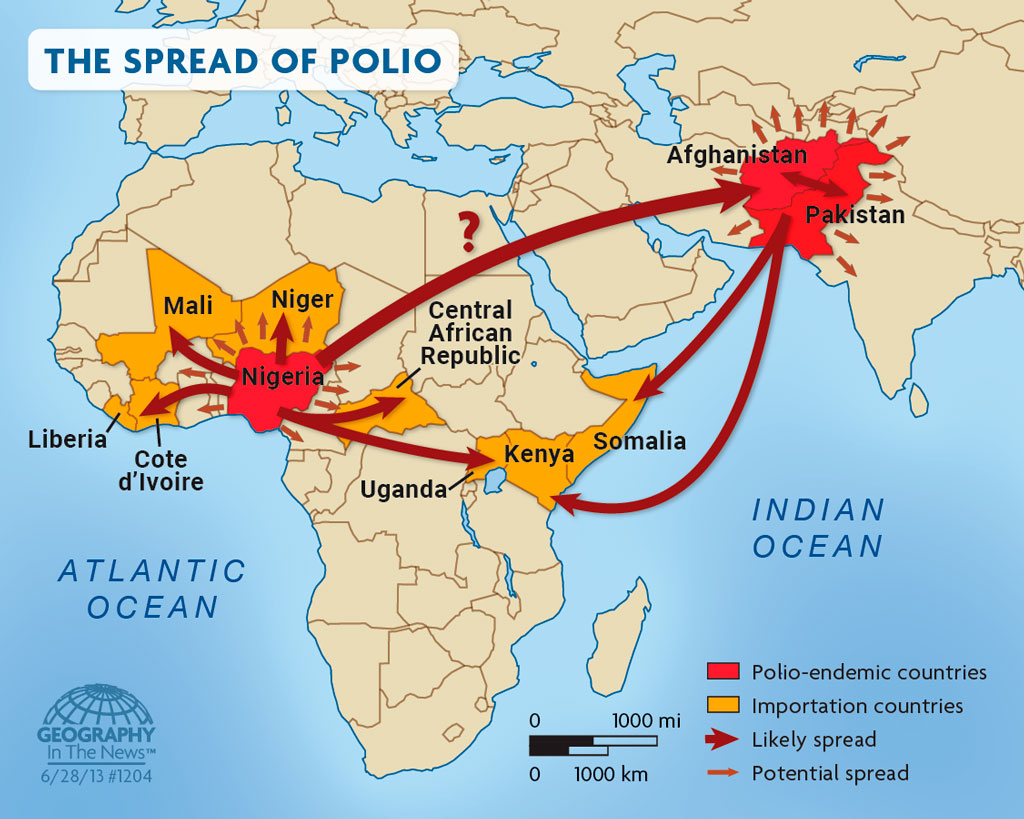
Polio cases began with a concentration in Afghanistan, then jumped to Somalia, Kenya, and Nigeria. The disease spread to Nigeria’s neighbors in Africa, before it was finally halted through the efforts of multiple relief organizations’ vaccine programs, including The World Health Organization (WHO),The United Nations Children’s Fund (UNICEF), Rotary International, and the Centers for Disease Control.
So how can a microscopic virus jump thousands of miles from Afghanistan to Nigeria? Clearly, modern technology played a role in moving such great distances over the earth’s surface. What made the countries adjacent to Nigeria so susceptible to the spread of polio? These are geographic questions on the minds of health officials as they battle communicable diseases worldwide everyday.The mobilities of viruses around the world require constant attention.
Note: You can reduce your odds of infection by frequent hand washing, using tissues and avoiding touching your face when you sneeze. Cleaning your work spaces and using a mask, or covering your mouth when you cough, are also good practices.
And that is Geography in the News.
Material in this article comes from “Polio Returns with a Vengeance” (2013), an original article for Geography in the News by Neal Lineback and Mandy Lineback Gritzner.
AAG’s Geography in the News is inspired by the series of the same name founded by Neal Lineback, professor and the chair of Appalachian State University’s Department of Geography and Planning. For nearly 30 years from 1986 to 2013, GITN delivered timely explainer articles to educators and students, relevant to topics in the news. Many of these were published on Maps.com’s educational platforms and in National Geographic’s blogs. AAG is pleased to carry on the series.
Vocabulary
- Communicable disease
- Epidemic
- Fungus/Fungi
- Iconic
- Mutate
- Pandemic
- Strain
- Virus
Discussion
- What are some of the tools epidemiologists use to track how diseases spread?
- Why do we say that epidemiology is a science of time as well as space?
- What is the difference between an epidemic and a pandemic?
- What are some of the reasons that a virus can “jump” long distances?
Further Reading
“John Snow, Historical Giant in Epidemiology.” UCLA https://epi-snow.ph.ucla.edu/
“Medical Geography and Why We Need It.” University of British Columbia. https://geog.ubc.ca/news/medical-geography-and-why-we-need-it/
Milner, Greg. “Creating the Dashboard for the Pandemic.” Esri ArcUser, Summer 2020. https://www.esri.com/about/newsroom/arcuser/johns-hopkins-covid-19-dashboard
“Notes from the Field: Outbreak of Poliomyelitis — Somalia and Kenya, May 2013,” Centers for Disease Control, Morbidity and Mortality Weekly Report. At https://www.cdc.gov/mmwr/preview/mmwrhtml/mm6223a7.htm
“What Is Epidemiology?” Epidemiology for the Uninitiated. BMJ Group. https://www.bmj.com/about-bmj/resources-readers/publications/epidemiology-uninitiated