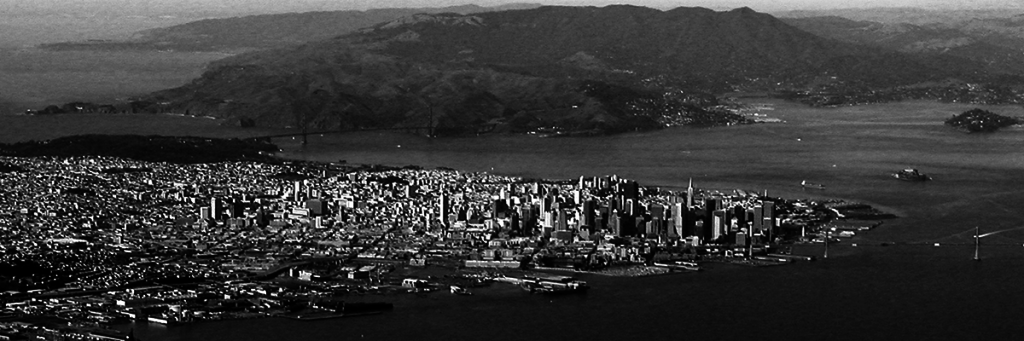
San Francisco, on the Golden Edge
The AAG returns to San Francisco for its annual gathering in 2016, our fourth visit following successful meetings there in 1970, 1994, and 2007. Given the unique strengths of geospatial science for the synthesis of human, physical, economic, historical, demographic, and other elements into a composite picture, the San Francisco Bay Area is a rich setting for our meeting. A “golden edge,” that sits in a cradle of faults aligned along the margins of two of Earth’s vast plates—the North American and Pacific. Evolving through a colorful history plated with wealth from a sequence of economic booms, beginning with gold and silver, then railroads, land development, oil, and war industries, on into aerospace, and the computer era. San Francisco is a place on the edge in many ways, setting styles, tones, and motifs that season our life and times.
At this time in geologic history, in absolute motion, the North American Plate progresses westward pressing against a Pacific Plate that moves northwestward. Yet, the relative motion of faults along the San Andreas system is right-lateral (one side is moving to the right relative to the other side), in a series of strike-slip faults. Crustal plates do not glide smoothly past one another. Instead, tremendous friction exists along plate boundaries, where stress (a force) builds strain (a deformation) in the rocks until friction is overcome and the sides along plate-boundary edges suddenly break loose in an earthquake along a fault line (see: https://earthquake.usgs.gov/).
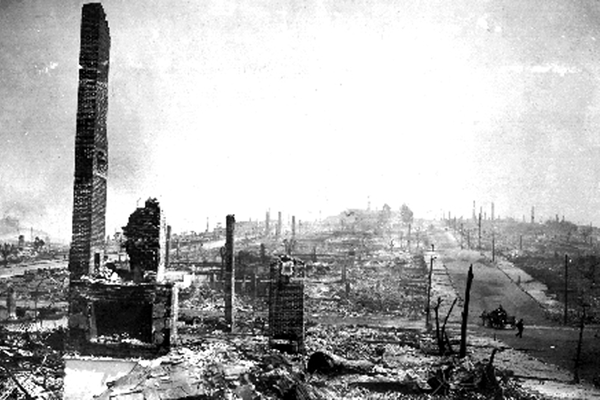
On April 18, 1906, at 5:12 A.M., nearly 400 km (248 miles) of plate boundary snapped into new positions releasing a magnitude (M) 7.9 earthquake. This long seismic event, some 110 seconds in duration, killed 3000 people and caused more than a billion dollars in damage (correct estimates)—exact numbers may never be known because of the post-quake public relations machinery. This great quake caused fires, cracked brick cisterns of badly needed water, and led to near-complete devastation of a major U.S. city that was populated by 400,000 people.
The San Francisco quake triggered the exhaustive Lawson Report, chaired by Andrew Lawson, U.C. Berkeley, which broke much new ground in seismology (The California Earthquake of April 18, 1906: Report of the State Earthquake Investigation Commission: Carnegie Institution of Washington Publication 87, 2 vols.). In the report, the elastic-rebound model described the horizontal nature of faulting in the 1906 event. The response of soft mud and landfill and liquefaction, as compared to sand/gravel, and bedrock bases was mapped. Many lessons were laid out for politicians, academics, and the public (see: https://earthquake.usgs.gov/regional/nca/1906/).
As financial and political interests looked ahead from their 1906 vantage point, a collective fear was that the earthquake would forever taint San Francisco. In contrast, after the great 1871 fire in Chicago, the city was rebuilt and better fire-fighting capabilities harnessed. However, what do you do with an earthquake threat? The region around San Francisco experienced major quakes in 1838 and 1868 and no one knew what was to come. For the bulk of the twentieth century following 1906, underreporting death counts and destruction was standard procedure, incorrect estimates of 700 dead and $250 million in damage the fictional report. Corrected estimates were finally published in 1989, ending 83 years of false numbers.
A deliberate decision was made to put up a smokescreen and talk of the great “San Francisco Fire” as the primary event in 1906, and for years it was called “the great fire,” with excess smoke cartooned on B&W photos to sell the label. A century of growth and progress ensued—landfill replaced about half of the surface area of San Francisco Bay to create new real estate, building height restrictions were waved, and growth crawled across known fault zones. The region was all set for the third game of the 1989 Baseball World Series between the San Francisco Giants and Oakland Athletics.
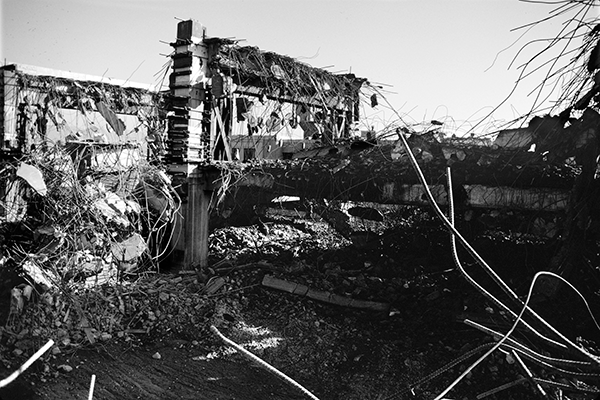
As the players warmed up and sportscasters exercised their voices, disaster struck at 5:04 P.M. (PDT), as a M 7.0 quake rocked the region and Candlestick Park. Areas of landfill around the bay, mapped in the 1908 Lawson Report, failed. The soft muds under a 2 km (1.2 mi) portion of the Route 880 Cypress freeway structure collapsed killing 42 people—unsuspecting victims, listening to the baseball preliminaries on their car radios (Figure 3). A section of the critical San Francisco–Oakland Bay Bridge fell, adding to the combined total damage of $8 billion across the region. The Loma Prieta quake was unique, for as the broadcast signal resumed, a global audience watched the events unfold. Overall, 67 people died in the region.
What does the future hold for this most cosmopolitan of U.S. cities? Earthquake forecasting is not just a science because earthquake prediction, fault maps, and related negative publicity for a city fuels political debate. Applicable here is an established axiom from geographic science: “A valid generalization is that humans and their institutions are unable or unwilling to perceive hazards in a familiar environment.” Long-range planning is a complex subject and an important challenge to us in geographic education. After the Loma Prieta earthquake in 1989, the National Research Council concluded in a report that,
One of the most jarring lessons from these quakes may be…the cost-effectiveness of mitigation and the importance of closing the knowledge gap among researchers, building professionals, government officials, and the public are only two of the many lessons from the Loma Prieta that need immediate action.
Any quake forecast must consider the duration, strength, soil types, and building designs affected. There are seven major fault lines across the San Francisco region and the public invested hundreds of millions in bonds over the past 30 years toward mitigating damage and loss of life. Future large earthquakes to relieve accumulated strain along fault boundaries are a certainty! The USGS in 2008 estimated for the Greater Bay Area a 63% probability of a major quake, M 6.7 or greater, in the next 30 years—similar to a Working Group 2002 forecast. Portions of the Hayward Fault in the East Bay have a slightly higher probability, (see: https://earthquake.usgs.gov/regional/nca/ucerf/).
Despite these forecasts and quake probabilities, the surge continues skyward. Near First and Fremont Streets (415 Mission Street, south of Market Street), is the construction site of the $1.1 billion, 326-m (1070-ft) Salesforce Tower. The landfill-sited building on Mission Street, when checked against shoreline maps from 1860, would have been the San Francisco Bay. If and when completed this be will be the second-tallest building west of the Mississippi River, because an even taller building is going up on Wilshire Boulevard in Los Angeles, in the other forecasted earthquake region of California.
Please take time on your visit to go on one of the related AAG field trips. Venture down Montgomery Street and imagine that this was the beach in the late 19th century, with the bay to the east. Off Fifth Street and Market, visit Clara and Shipley Streets and observe the obvious subsidence in some of the buildings. And, given the analytical tools the geospatial sciences enjoy, we see the wealth of ingredients that truly make San Francisco the “golden edge” of the continent.
— Robert W. Christopherson
Robert W. Christopherson is Professor Emeritus of Geography, American River College, and is the author of Geosystems, 9/e, Elemental Geosystems, 8/e, (both with Dr. Ginger Birkeland), Geosystems Canadian Edition, 4/e Applied Physical Geography, 9/e, (with Charles Thomsen), and soon to be published Geosystems Core, 1/e, (with Charles Thomsen and Stephen Cunha), all published by Pearson Prentice Hall. E-mail : bobobbe [at] aol [dot] com; P.O. Box 128, Lincoln, CA 95648.