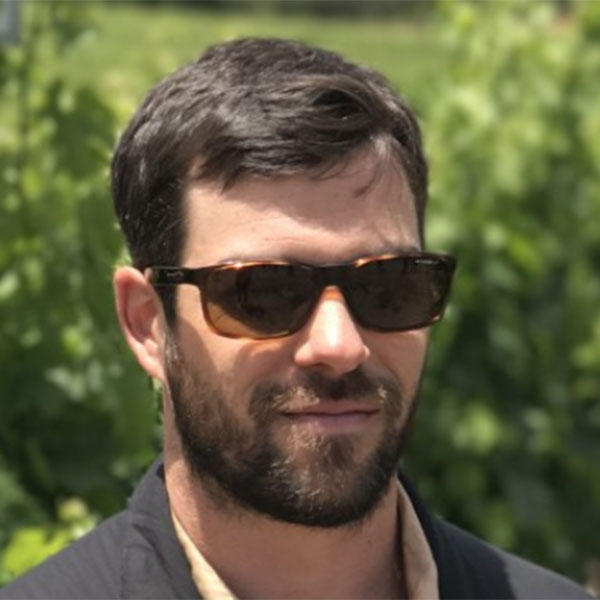
Brent Sams
Viticulture Research Scientist, E&J Gallo Winery

Education: Ph.D. in Horticulture (University of Adelaide), Master of Geography (Virginia Tech), B.S. in Geography (University of North Alabama)
The following profile was compiled by Brendan Vander Weil (Texas State University) for the Encoding Geography initiative. To learn more, visit: https://www.ncrge.org/encoding-geography/
Describe your job, employer, and the primary tasks you perform in your position.
My current role as a Viticulture Research Scientist at E&J Gallo Winery is to design and execute research projects focused on understanding how fruit chemistry/quality change over time and space. I am interested in these changes from the within-vineyard scale to the regional scale. To accomplish this, I (with a lot of help from others) use a wide variety of field measurements (fruit zone light exposure, vine canopy temperature, soil cores, and many others), proximal sensing (electric conductivity, elevation mapping), and remote sensing (satellite, UAV, commercial aircraft). I spend a good deal of time analyzing how these measurements are connected.
How has your education/background in geography prepared you for this position?
The interaction of geography and computer science is essential for my role, along with many others in my department. At the project level, I work with different types of datasets that must be organized so that they can be analyzed and interpreted together. I rarely start any of this in GIS, but in a statistics package/program. I don’t have a background in computer science or coding/programming, but these have been very useful skills to develop. Once I have a product/model/application, it needs to be available for use by our stakeholders. This can be a dashboard, a database, or other digestible format which usually implies additional knowledge of other programs or applications. Probably the most specific use of geo-computation in my role is in the geostatistical analyses of grape samples collected from different densities and locations.
What is an example of applying geography concepts and skills in order to analyze and solve problems in your work?
Recently, we’ve been working on a project to combine data from multiple vineyards to add statistical robustness to the spatial analysis of low-density grape samples. To validate the method, we divided up the vineyards into fishnet grids to create a Monte Carlo simulation that would iterate through many different combinations of field samples based on their locations.
What types of geographic questions did you ask and think about in your project?
We were interested in how wine grape chemistry changed over time and space, and at specific locations from the within-vineyard scale to the regional or statewide scale; how farm management and the environment are connected; and how we could use all of these variables to make predictions about where to find the best fruit. All this information needed to be synthesized and made into something that could be analyzed by a computer. Sometimes in the quantitative analysis world we are faced with qualitative variables and how to incorporate things like, “How does this vineyard manager decide when and how much water to irrigate?.” These then need to be summarized into something we can include in a mathematical model.
What types of data did you acquire to support your project?
For this project, we were mostly interested in the chemistry of grapes processed in a lab after the sample location was tagged with a GPS unit. In a related project and at the same locations, we measured soil texture, the fraction of useful light into the fruit zone of the canopy, and yield.
What types of content knowledge and skills (both geographic and more general) did you use to evaluate, process, and analyze the data you gathered for your project?
Everything starts with the synthesis of what’s been done, where, and how. Experimental design and sampling strategies are also necessary. There are a lot of measurements specific to grapevines that we used, but general statistical knowledge was also necessary for writing reports, publications, etc. I use R and R Studio quite a bit, as well as several GIS applications with a bunch of different spatial analyses. One specific example is the use of k-means classification with raster datasets to assess patterns that exist between different layers such as interpolated chemistry maps with soil maps or imagery.
How did you communicate the results of your project (e.g., writing technical reports, making maps and geo-visualizations, creating graphics, data tables, etc.)? Do you have a recent product or publication to share with us as an example?
There will be a few publications from this data set, as well as reports to internal stakeholders. You can find those publications below:
- Sams, B., Bramley, R.G.V., Sanchez, L., Dokoozlian, N.K., Ford, C.M., and Pagay, V. (2022) Remote sensing, yield, physical characteristics, and fruit composition variability in Cabernet Sauvignon vineyards. American Journal of Enology and Viticulture 73, 93-105.
- Sams, B., Bramley, R., Sanchez, L., Dokoozlian, N., Ford, C. and Pagay, V. (2022) Characterising spatio-temporal variation in fruit composition for improved winegrowing management in California Cabernet Sauvignon. Australian Journal of Grape and Wine Research. https://doi.org/10.1111/ajgw.12542
- Sams, B., Bramley, R., Aboutalebi, M., Sanchez, L., Dokoozlian, N.K., Ford, C.M. and Pagay, V. (2022) Facilitating mapping and understanding of within-vineyard variation in fruit composition using data pooled from multiple vineyards. Australian Journal of Grape and Wine Research. https://doi.org/10.1111/ajgw.12556
What are the criteria that you use to assess the quality of your results?
I’m an applied researcher in the private sector, so while the publications are nice, I really want to know if something works. Does it help us do something, save us money, or even make us more money?
This material is based upon work supported by the National Science Foundation under Grants No. 2031418, 2031407, and 2031380 (Collaborative Research: Encoding Geography – Scaling up an RPP to achieve inclusive geocomputational education). Any opinions, findings, and conclusions or recommendations expressed in this material are those of the author(s) and do not necessarily reflect the views of the National Science Foundation