The Battle for SBE and Science Funding: What You Can Do

In early April, the White House published its proposed budget for Fiscal Year 2027. In its current form, the proposal threatens the core of U.S. scientific leadership; and if passed by Congress, would impose devastating cuts to programs supporting geography, climate, and spatial sciences.

These proposed reductions included a 55% cut to funding for the National Science Foundation (NSF), and the elimination of the Social, Behavioral, and Economic Sciences (SBE) directorate. The impact of this proposed elimination is already being felt, with Nature reporting that NSF leadership is moving to comply in advance by dissolving the directorate entirely, strictly on the basis of the White House request.

Historically, the Social, Behavioral, and Economic Sciences Directorate has been a cornerstone of funding for geographers, and social and psychological scientists, supporting nearly 63% of all academic research across those disciplines, but it suffers from an administrative hurdle that other directorates do not have: it was not statutorily established. SBE was established in the early 1990s because of years-long advocacy by social scientists who believed it should exist outside of the biology directorate. In 2017, NSF reaffirmed the value of SBE research to the nation’s priorities in a report that asserted  “The diverse SBE sciences that are supported at NSF—anthropology, archaeology, demography, economics, geography, linguistics, neuroscience, political science, psychology, sociology, and statistics—produce fundamental knowledge, methods, and tools for a greater understanding of people and how they live,” knowledge that forms a foundation for acting on national priorities in keeping with the NSF mission.

Nonetheless, SBE’s lack of statutory status reduces its legal and budgetary protections.

The Administration took similar measures in 2025, when it proposed the elimination of the directorate in the 2026 Budget. Due to push-back from many in the science community, including geographers, Congress took measures to limit these cuts, ensuring that the SBE would be able to operate at least through FY 2026.

This iteration of the administration’s budget proposal is likely to face a steep uphill climb in both halls of Congress, as it did in 2025, with members from both sides of the aisle articulating their support for sciences. We must continue to show our legislators that funding for spatial science matters.

What’s next?

In the past two weeks, the House and Senate Budget Committees held their first hearings with the Director of the Office of Management and Budget (OMB), Russell Vought. These were the first opportunities for the administration to defend the proposed cuts. During these marathon sessions, members from both sides of the aisle grilled the OMB Director on cuts to NSF, and other domestic agencies, voicing their displeasure with the impact that this would have on research across the board. Each chamber will work to draft and complete their concurrent budget resolutions by months-end.

In the month or so ahead, the budget will move through both Chambers’ appropriations committees, where it will be marked up for hopeful completion by the end of June. The subcommittees most important in determining how NSF, and SBE funds are appropriated include the House and Senate Subcommittees on Commerce, Justice, Science, and Related Agencies (CJS). The House Subcommittee will hold its markup on April 30, 2026, followed by a full House Appropriations Committee markup on May 13, 2026. Both will be public unless voted on as otherwise by committee members.

Congress must approve a budget, to be sent to the President’s desk by the 30th of September, or face a government shutdown.

What can you do?

  • Document how SBE funding has made an impact on your work, your institution, and especially your community and the nation. Send examples to advocacy@aag.org and use them in your communications with your Congressional representatives.
  • Reach out to your member of Congress, using tools like those provided by the Consortium of Social Science Associations, and AAG’s Action Kit to urge your member of Congress to recognize the importance of disciplines like geography to the nation’s long arc of innovation, and to express any concerns you may have related to the elimination of this crucial directorate of the NSF.
  • Attend the May meeting of the National Science Board (the governing body of the NSF) to hear what is planned for this storied institution in the coming months.
  • Encourage members of your network, such as department leaders, provosts, executives in the private sector, to be in touch and amplify your message.
  • Add your voice to the public dialogue on science funding. Many people in your community may not even know the stakes of this battle. Write an op ed, schedule a talk at your library, or share on social media. AAG’s Action Kit has ideas and how-to’s.

Stay alert to the appropriations process as it progresses, and stay in touch with AAG through advocacy@aag.org with your questions and ideas.

    Share
    Share

The AAG Annual Meeting Revenue Flow

By Antoinette WinklerPrins, AAG Council Treasurer


Photo of Antoinette WinklerPrinsThis is the last message by outgoing 2024-2026 Council Treasurer Antoinette WinklerPrins. In her earlier series, she helped illuminate several financial dimensions of a professional organization such as the AAG. In this column, she shares a visualization of the income and expenses flow of the AAG’s Annual Meeting. Read previous columns.


We recently gathered for our annual meeting in San Francisco—a celebration of the broad and diverse community that geographers are. The annual meeting is a key activity for the organization and its members.  We had over 5,000 registrants and 1,200 sessions, with the majority being held in person, with a hybrid option for session organizers who opted in. Running a meeting is an expensive affair, and arrangements are usually made many years ahead of time, with some costs locked in while others are set at the time of the meeting.  This means that there can be inflationary pressures on costs, as there was this year.

The figure below illustrates the flow of the 2026 AAG Annual Meeting Revenue and Expenses—demonstrating the fixed and variable costs that must be accounted for.

Sankey diagram titled “AAG Annual Meeting Revenue and Expense Analysis.” Revenue flows from registration (79%), exhibit booths (4%), sponsorships (7%), and other sources into total meeting revenue. Expenses flow into categories such as hotel, facility, and catering (22%); audiovisual services (23%); contracted meeting services (17%); staff capacity (25%); and smaller technology and administrative costs. Expenses ultimately divide into 62% variable costs and 38% fixed costs. Credit: Betsy Orgodol
Credit: Betsy Orgodol


The AAG operates on a break-even model for its annual meeting and sets its registration fee accordingly, but has to do so ahead of time without knowing precisely how many people will register, nor how some costs will change.

Annual Meeting variable expenses consist primarily of usage-based costs such as catering, certain hotel and facility fees, and audiovisual services—these are not fixed when the contract is signed, and depend on factors such as the number of registrants and number of sessions. The AAG contracts several meeting services, such as meeting and exhibit managers, decorators, childcare services, conference assistants, security, and service providers for conference participants who need accommodation. Staff capacity, insurance, and software technology fees are largely fixed costs that do not change based on the size of the meeting or the number of attendees.

The cost structure the AAG uses provides more flexibility and scalability—when attendance is strong, total expenses rise proportionally but are matched by increased registration and sponsorship revenue, enabling the organization to serve more participants without compromising the quality of the meeting experience. When attendance is smaller, costs decrease in areas like catering and certain service charges, though only to a limited extent since some baseline expenses remain fixed; even so, the meeting can be delivered efficiently while maintaining a consistent standard of value for attendees.

The AAG consistently works to control more costs to ensure that resources are used efficiently and that the meeting remains both financially sustainable and rewarding for attendees. While the AAG strives to conserve meeting expenses in the most efficient manner possible, inflationary pressures, such as those driven by tariffs impacting meeting-related costs and California sales and use taxes, presented a challenge this year.  The combination of planning and contracting ahead helped AAG absorb some of these costs.

We realize that it may feel that registration fees are high; the break-even model for pricing is meant to provide you with the services the membership has asked for and expects (refreshments and meals, hybrid options, childcare, and accommodations for disabilities, among others) and to assure that the meeting is a quality event and a positive experience for all.

Please feel free to reach out to me or Gary Langham, AAG’s Executive Director with questions, comments, or concerns. Send your comments and questions with the subject line “Treasurer’s Corner” to helloword@aag.org.


    Share

Geographic Ignorance, the Iran War, and the End of US Hegemony

William Moseley

Great powers die when they needlessly fritter away their advantages. While I was never a fan of US hegemony, it did confer benefits to the country’s economy and its citizens. The War in Iran is the crowning blow to a year-long string of reckless moves that effectively destroy American hegemony by undermining the country’s moral positions, weakening its economy, and entangling the nation in an unwinnable war. A deeper understanding of geography could have mitigated such miscalculations, something future political leaders and the US public need to better understand if further missteps are to be avoided.

First, the current US administration has taken a sledgehammer to the existing world order built on multilateralism and a commitment to basic human rights. This system was erected in the mid-20th century by the US and its allies in the wake of two devastating world wars. While the US and other powers violated the rules of engagement in a number of instances, there was enough of a commitment to multilateral institutions and fundamental principles that the system ensured a modicum of stability and shared economic benefits. The current administration’s zero-sum view of the world cannot comprehend the advantages that come with cooperation and soft power—and it has done everything possible to undermine multilateralism and destroy US bilateral foreign assistance.

In unilaterally blundering into the war in Iran, the US administration made no attempt to bring along other allies and then was shocked when European countries were unwilling to assist in the endeavor. The crowning blow came on April 7 when President Trump threatened to destroy Iranian civilization if the regime did not comply with his demands: “A whole civilization will die tonight, never to be brought back again.” Let us be clear that such wanton mass destruction is defined by international law as a war crime. This was a major breach of international moral strictures, shattering whatever remained of principled American leadership, and these statements were swiftly denounced by the Pope and other religious leaders.

Second, the debt-sponsored spending of the current administration has reached historic heights. The US national debt has now hit $39 trillion, and over the past year we have seen the fastest accumulation of a trillion dollars in debt outside of the pandemic. As of early April, the US had spent $28 billion on the war in Iran, a figure that keeps climbing. Such massive debt accumulation, coupled with cuts in research spending, will undoubtedly weaken the US economy for years to come, effectively diminishing economic might as a major component of US power on the world stage.

Geographical Perspective Is Badly Needed

Third, since February 28, the US has actively been engaged in military attacks on Iran (although we are in the midst of a shaky ceasefire as I write). This war of choice is an enormous strategic blunder as the US administration has plunged the country in an unwinnable conflict by failing to comprehend: 1) the cultural geography of Iran, 2) the daunting physical geography of the Strait of Hormuz (a major pinch point through which 20% of global oil and liquified natural gas pass), and 3) the ongoing vulnerability of the US economy to global oil shocks.

The US administration has grossly misread the cultural, social and political geography of Iran. Iran, formerly Persia, is one of the oldest nation states in the world, with organized settlements dating back to 3200-4000 BC and the first Persian Empire emerging in 550 BC (Achaemenid Empire). The result is not just an ancient cultural complex, but a relatively large country (with 90-some million people) with a strong national identity. This is also a region where the US has behaved badly in the past, supporting a covert coup to oust a democratically elected prime minister in 1953, and then installing Shah Mohammad Reza Pahlavi who ruled until the Iranian Revolution in 1979. While there had been social unrest and internal discontent with the Islamic Regime in recent months and years, the lack of a more robust, organized resistance movement, and a formidably repressive regime, meant that a popular uprising in the wake of US and Israeli air attacks was unlikely. Even with an Iranian public that feels deep antipathy towards its rulers, such an uprising became even more unlikely when the US president made genocidal calls for the destruction of Iran’s civilization, effectively alienating a population with a deep sense of pride in its country.

The Strait of Hormuz is a physical pinch point in the global trade of oil and liquified natural gas. Exports originating in the Persian Gulf must pass through this strait controlled by Iran and Oman (although more so by Iran) (see map below). Iran’s extensive coastline is better suited for controlling the Persian Gulf and the Strait compared to its smaller, southern neighbors. More specifically, Iran’s long, continuous and mountainous coastline, coupled with multiple islands, and a relatively narrow deep-water channel through which large ships can pass, allows them to effectively monitor and mount guerrilla attacks on passing ships. As has been noted elsewhere, Iran does not need to halt all shipping, but only sporadically hit a few targets in order to bring a halt to all commercial shipping. It is increasingly clear that the US Administration and its war planners underestimated the import and difficulty of controlling this area.

Map of Straight of Hormuz and surrounding countries
The Strait of Hormuz, within the context of Iran and region. Cartography by Sophia Spisak, Macalester College, adapted from Encyclopedia Brittanica. Data sources: ESRI, Food and Ag. Org. GAUL, GADM, UN OCHA, USGS, Who’s on First.


The United State is still heavily dependent on fossil fuel consumption, with the current administration having abandoned all attempts to build up alternative energy sources. While other countries have worked hard to develop fossil fuel independence, the US administration has refused to understand that a fossil fuel-based economy is not only problematic in environmental terms, but it also leaves the country vulnerable to shocks in the global energy system. Although the US is the largest fossil fuel energy producer in the world, and largely creates what it needs, energy prices are deeply intertwined, meaning that disruptions in one part of the system reverberate throughout the world. As such, the US President’s claim that a closed Strait of Hormuz is not his problem represents a fundamental misunderstanding of how global energy market’s function. It also means that the US is still deeply vulnerable to the energy price shocks created by the closing of the Strait of Hormuz, including less obvious consequences such as higher fertilizer prices for farmers (which will impact food prices) and more profits for oil exporting adversaries such as Russia.

The War in Iran will be a Pyrrhic victory for the US at best. While the US president may eventually claim some sort of win, in the process he will have destroyed the country’s moral credibility and soft power, permanently set back the American economy, and created an unstable quagmire in Iran. The end result will be a hastened end to US hegemony brought about by hubris, cultural arrogance, and ignorance of geography.


Please note: The ideas expressed in the AAG President’s column are not necessarily the views of the AAG as a whole. This column is traditionally a space in which the president may talk about their views or focus during their tenure as president of AAG, or spotlight their areas of professional work. Please feel free to email the president directly at moseley@macalester.edu to enable a constructive discussion.


    Share

Member Profile: Dydia DeLyser

Photo of Dydia DeLeyser
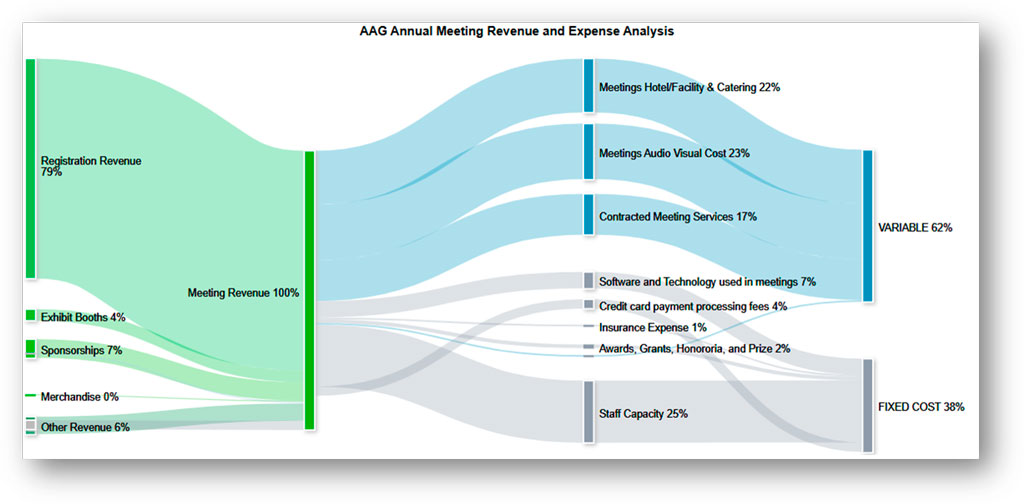
“Figuring out what places are about” is the foundation of Dydia DeLyser’s inquisitive, hands-on work to explore and preserve American landscapes and cultural histories. A professor of geography emerita at Cal State Fullerton, DeLyser has cultivated this outlook from early on. As the child of Dutch immigrants who came to the U.S. in the 1960s, she learned early how place, belonging, and language could open—or close—doors.

“My first language is not English, it was Dutch,” she says. “So my earliest memories are of having sort of a secret language at home that nobody else could understand.” Her parents were “always trying to understand American culture, and yet never able to become a part [of it].”

For DeLyser, the outsider status was doubled by another kind of “outside:” the past. Her parents’ vivid stories of their experiences of World War II and the privations of life in Europe even before Nazi occupation lit up DeLyser’s imagination and appreciation for social history: “The broader cultural stories about our past, like my parents’ stories about the war, are also intimate personal stories that happen in the lives of individuals,” she says. “We connect our individual experiences to the broader narrative, you know, of victory over the Nazis or so many other issues. That’s a geographical or spatial experience.”

DeLyser’s hunger to understand and embrace places and times she couldn’t know firsthand have led to her foundational preoccupation with what she calls “the intimate geographies of social memory.”

Bridging Time and Space

DeLyser started working on her intertwined study of history’s large scales and intimate personal histories while she was still an undergraduate at UCLA, aided by her work at UCLA Library’s Department of Special Collections in the manuscript, photographs, and rare books library, one of the largest such departments in the country. The archive housed the personal papers of L.A. notables and international figures such as novelist Raymond Chandler, journalist Carey McWilliams, writers Henry Miller and Anaïs Nin, and Peggy Hamilton, the first fashion editor of the LA Times.

Reading their letters and manuscripts opened DeLyser’s eyes to new ways of knowing people, even after their deaths. Research—specifically, qualitative research with primary materials—was like a portal through the gap in time and place that had so fascinated and frustrated DeLyser from childhood. She has dedicated her career to the methods that make qualitative research vibrant.

“To me, scholarship should be empirically rich, grounded in some real thing,” she says. “It should be theoretically sophisticated and engaged with whatever conceptual conversations are current and engaging and relevant in the discipline or subdiscipline you are in, and it should be methodologically articulate.” Put simply, she says: “You should be clear how you know.”

DeLyser describes research methods as “an important form of credibility for a scholar, as the core of your scholarly credibility. If you can show how you know—because you interviewed these people or because these are the quotes or because you did this archival research or you spent ten years observing at this place or because you actually did the labor or whatever the reason—If you can show how you know, then we will trust you. And then we’ll be able to learn from you, we’ll be able to take on whatever your point is.”

If you can show how you know, then we will trust you.”

Early in her career, DeLyser established a close relationship to Bodie, a California ghost town in the Eastern Sierra region. Designated a National Historic Landmark and state park in the early1 960s, Bodie began as a gold-mining town that boomed in the 1870s, crashed in the 1880s, but then lingered well into the 20th century. As the population declined, at one point there were more buildings than people. And as residents left, they abandoned furnishings and things they didn’t want to pay to move, which became the  intact artifacts of their daily lives on display in about 200 buildings, from dishes, pots, and chairs in kitchens to unused caskets in the town morgue.

Exterior view of a building in Bodie, Calif. Credit: Jon Sullivan, Wikimedia Commons
Credit: Jon Sullivan, Wikimedia Commons


Starting when she was a college student with summers free, she began working as a low-paid, unskilled seasonal worker for maintenance, DeLyser gradually deepened her knowledge of Bodie over the next 35 years in all different ways, from conducting ethnographic research tourists there to using the Park’s own archive to understand how State Parks staff were themselves shaping what visitors saw and ultimately to using her research to make the case for broadening the town’s National Historic Landmark status, all while putting in true sweat equity in caring for the town, from physically working to stabilize the abandoned buildings to “cleaning about 10,000 [public] toilets.” Now, she is executive director of the town’s nonprofit, working to preserve Bodie in a state of “arrested decay—keeping the buildings standing while letting them look like they’re still falling down,” according to DeLyser. Today’s visitors to Bodie can peer inside its buildings to see the many personal items left behind by the final occupants, and imagine the lives of the town’s former inhabitants. DeLyser was interested in the impact of this on visitors, especially in the moments of recognition when a specific object reminded them of something in their own lives. DeLyser then sought to map these personal epiphanies onto the larger stories of history.

Interior view of a kitchen in Bodie, Calif. Credit: Fronl, Wikimedia Commons
Credit: Fronl, Wikimedia Commons


“Ghost towns are so connected to the mythic West in the United States, to the heroic, mythologized tales of the “Wild West” and all that, we simply connect ourselves to big themes about American culture. All of a sudden, from a small life and a small object, it links to the big themes. I’ve seen myself have ordinary objects spark magic in my life many times, and I’ve studied how it happens.“

Always say yes

DeLyser also engages enthusiastically as a teacher, mentor, and champion of the geography discipline. Over the years, she has served on AAG Council, was a founding member of the AAG Qualitative Research Specialty Group, contributed to the work of the AAG Harassment Free Task Force, as well as its Public and Engaged Scholarship Task Force. She worked tirelessly during the COVID pandemic to deliver supportive programming for graduate students, and also serves on the AAG Climate Committee, to name only a few contributions. It’s part of her commitment to hold the door open for the next generation of geographers.

“I’ve had to bust open doors myself in my career, but the point isn’t about busting open doors. The point is to hold the door open and create a pathway for success for the people who will come after us,” she says.

She brings the same esprit de corps to her research and publishing. “There’s no sense in scholarship unless it’s shared,” she says. “If I can learn something from my scholarship about the past, I feel obligated to share that, otherwise I take it with me. It happens in the moment, it happens in the present, but it’s always for the future.”

Living in Bodie, where only Park staff now live, gave DeLyser a strong sense of community, and a strong desire to give back to that community, something that has followed her throughout her career.

DeLyser is careful to appreciate and credit the communities she works with. Years later, as she launched a new research project about how neon signs have shaped the American landscape she recognized that there was a “neon community” or “communities” in the U.S., and, she says, “I wanted people to feel like they knew who I was and they welcomed my work, so it took me a long time to become part of that community, vested in being part of a community as ‘neon people.’” DeLyser says neon signs are “an incredibly overlooked part of the American landscape. People read the sign that says “OPEN” over the door that’s red and blue—they read that sign without even realizing that they’ve read it.” She wanted to bring those hidden signs and their hidden stories to light.

DeLyser had been introduced to the behind-the-scenes world of neon by her husband and longtime creative partner, Paul Greenstein, an expert in the history and repair of classic neon signs. Early in their relationship, she accompanied him to repair a sign over a restaurant, and the adventure sparked questions and conversations, which in turn led to more than a half dozen collaborations over the years. Greenstein and DeLyser have delved into the history and cultural significance of neon, antique cars, and Indian motorcycles. Their 2021 book Neon: A Light History  is the latest culmination of these collaborations.

DeLyser’s approach to research combines immersion in the topic, becoming embedded in the communities that hold deep knowledge about it. She sees her research across a spectrum of often deeply personal and committed hands-on experience and careful methodologies. “I had all the tools,” she recalls of her long relationship with Bodie. “I knew how to use a hammer and a Skilsaw, and I also I knew how to do an interview. I had a hammer in one hand and a notebook in my pocket.”

    Share

Tracking the Geography of Diseases: How Epidemiologists Map Infection

Geography In The News logoGeography in the News is an educational series offered by the American Association of Geographers for teachers and students in all subjects. We include vocabulary, discussion, and assignment ideas at the end of each article. 


By Neal Lineback

Have you ever wondered where you caught a cold? If so, you’ve asked the first question epidemologists ask about infectious diseases. Epidemiology is the study of how diseases spread. It relies on geography to find its answers.

You could say that epidemiologists study the “where” of diseases. Specifically, they study the paths of communicable diseases.

What are communicable diseases? They’re the ones you can catch. These illnesses spread through viruses, fungi, or bacteria, typically from person to person, and sometimes from animals to people. Some diseases come from contaminated food, water, or insects. All of these transmissions relate to geography. 

Viruses and bacteria are all around us, particularly in dense human populations. Some are harmless. But dangerous viruses range across a whole host of diseases, from pneumonia and whooping cough to measles, chicken pox, and polio, among others.

Among the least dangerous to healthy individuals is the common cold, or Rhinovirus. Its symptoms are normally mild. The cold is so common that it’s almost impossible to know where you caught it—unless you are an epidemologist. Through contact tracing, distribution maps, and other tools, epidemiologists can find the initial source of an infection. It takes only one or two people for a disease to spread as contacts multiply.

Epidemiology is a science of time as well as space. Once a few people show symptoms, they could infect 50 percent or more of the people they come in contact with, within three to ten days. This makes swift analysis crucial.

A fast-moving virus can cause an epidemic or pandemic. The difference between the two is in distribution. The disease is distributed unevenly in an epidemic, with some communities having few or no cases. In a pandemic, many more people are sick across more areas. Deaths and hospitalizations are elevated too.

This is why the flu virus—which is actually a number of virus types that can mutate over time–and the COVID viruses are carefully tracked by their strain. Flu is also identified by type. If you have ever heard a strain of influenza referred to as A,B,C, or D, you have heard its type, based on its severity. “A” causes pandemics and is the most dangerous. “B” can cause epidemics. “C” causes mild cold-like symptoms. “D” is an animal variety.

The recent COVID outbreak in 2020-2023 was a pandemic in the United States. Ensheng Dong, a Ph.D. student at Johns Hopkins University, was one of the first people in the world to create a map-based dashboard to show the disease’s spread. Using a Geographic Information System (GIS), Dong worked with physicists, geographers, and others at the university to build a map to track outbreaks. Its red-on-black appearance became iconic.

Outbreaks of many viral infections can be mapped. The CDC (Centers of Disease Control) and other international medical institutions maintain huge geographical databases to follow outbreaks around the world. This research is critical in slowing, treating, and containing viral diffusions and concentrations, allowing the medical professionals to predict where intervention (ie. tests, warnings, and vaccinations) can be helpful in reducing deaths and hospitalizations.

Epidemiology is still a young science. Less than 175 years ago, a doctor named John Snow identified the source of the 1854 cholera outbreak in London: a neighborhood water pump. He did this by mapping all of the cholera cases in the area and interviewing the families. Once he identified the common location they’d used to draw water, he removed the handle from the pump. New cases fell.

This map shows the 2013 spread of polio worldwide:

This map by Rachael Carpenter indicates that the spread of polio began with a concentration in Afghanistan, then jumped to Somalia, Kenya, and Nigeria. The disease spread to Nigeria’s African neighbors Cote d'Ivoire, Mali, Niger, Central African Republic, Uganda, and Liberia.
In 2013, Geography in the News reported on a severe polio outbreak, showing the path of infection. Map by Rachael Carpenter


Polio cases began with a concentration in Afghanistan, then jumped to Somalia, Kenya, and Nigeria. The disease spread to Nigeria’s neighbors in Africa, before it was finally halted through the efforts of multiple relief organizations’ vaccine programs, including The World Health Organization (WHO),The United Nations Children’s Fund (UNICEF), Rotary International, and the Centers for Disease Control.

So how can a microscopic virus jump thousands of miles from Afghanistan to Nigeria? Clearly, modern technology played a role in moving such great distances over the earth’s surface. What made the countries adjacent to Nigeria so susceptible to the spread of polio? These are geographic questions on the minds of health officials as they battle communicable diseases worldwide everyday.The mobilities of viruses around the world require constant attention.

Note: You can reduce your odds of infection by frequent hand washing, using tissues and avoiding touching your face when you sneeze. Cleaning your work spaces and using a mask, or covering your mouth when you cough, are also good practices.

And that is Geography in the News.


Material in this article comes from “Polio Returns with a Vengeance” (2013), an original article for Geography in the News by Neal Lineback and Mandy Lineback Gritzner.

AAG’s Geography in the News is inspired by the series of the same name founded by Neal Lineback, professor and the chair of Appalachian State University’s Department of Geography and Planning. For nearly 30 years from 1986 to 2013, GITN delivered timely explainer articles to educators and students, relevant to topics in the news. Many of these were published on Maps.com’s educational platforms and in National Geographic’s blogs. AAG is pleased to carry on the series.

Vocabulary
  • Communicable disease
  • Epidemic
  • Fungus/Fungi
  • Iconic
  • Mutate
  • Pandemic
  • Strain
  • Virus
Discussion
  1. What are some of the tools epidemiologists use to track how diseases spread?
  2. Why do we say that epidemiology is a science of time as well as space?
  3. What is the difference between an epidemic and a pandemic?
  4. What are some of the reasons that a virus can “jump” long distances?
Further Reading

“John Snow, Historical Giant in Epidemiology.” UCLA https://epi-snow.ph.ucla.edu/

“Medical Geography and Why We Need It.” University of British Columbia. https://geog.ubc.ca/news/medical-geography-and-why-we-need-it/

Milner, Greg. “Creating the Dashboard for the Pandemic.” Esri ArcUser, Summer 2020. https://www.esri.com/about/newsroom/arcuser/johns-hopkins-covid-19-dashboard

“Notes from the Field: Outbreak of Poliomyelitis — Somalia and Kenya, May 2013,” Centers for Disease Control, Morbidity and Mortality Weekly Report. At https://www.cdc.gov/mmwr/preview/mmwrhtml/mm6223a7.htm

“What Is Epidemiology?” Epidemiology for the Uninitiated. BMJ Group. https://www.bmj.com/about-bmj/resources-readers/publications/epidemiology-uninitiated


    Share