Franklin, Buenemann Join Annals of the American Association of Geographers as New Editors
Rachel Franklin will take a new position as General Geography/Cross-discipline Editor, and Michaela Buenemann is the incoming Physical Geography, Earth, and Environmental Sciences Editor at Annals of the American Association of Geographers, effective January 2025. Buenemann will replace outgoing editor David R. Butler.
Franklin is a broadly trained human geographer with research expertise in population and spatial analysis. She is professor of Geographical Analysis at Newcastle University, where she researches spatial demography and spatial inequality. She is also keenly interested in pedagogy, especially the teaching of methods. In addition to her new duties at Annals, she edits the journal, Geographical Analysis. She is a visiting academic in Population Studies at Brown University and at the Gran Sasso Science Institute (GSSI) in L’Aquila, Italy. She brings to her work at Annals extensive experience as a member of several journal editorial boards, including Population, Space and Place, the Annals, the Journal of Regional Science, and the Journal of Geographical Systems.
One of Franklin’s primary goals is to “work diligently to promote the Annals and maximize its visibility, both within and outside the discipline.” She is especially interested in highlighting the commonalities across sub-fields, finding common ground throughout the discipline.
Michaela Buenemann, incoming editor for Physical Geography, Earth, and Environmental Sciences, is professor and head of the Department of Geography and Environmental Studies at New Mexico State University. Her interdisciplinary, international, and collaborative work features contributions in GIS, remote sensing, spatial modeling, landscape ecology, and biogeography. She has published in a wide range of geography, environmental sciences, and GIScience journals, and her research has been funded by numerous state and federal agencies. In the classroom and field, she teaches an array of courses in physical geography, socio-environmental systems, field methods, geographic information science and technology, and geographic theory and research design. She has contributed to the discipline of geography in various roles, including chair of the Southwest Division of the American Association of Geographers, Southwest Regional Councilor of the American Association of Geographers, and Southwest Regional Councilor of Gamma Theta Upsilon.
Buenemann brings to her editorship the experiences of seven years on the Editorial Board of the Physical Geography, Earth, and Environmental Sciences thematic area of the Annals. She is currently co-editing an Annals Special Issue on “National Parks and Protected Places” with David Butler and also serves as an Associate Editor for Regional Environmental Change. She earned her Ph.D. in Geography from the University of Oklahoma in 2007.
We are grateful to David R. Butler, outgoing editor for Physical Geography, Earth, and Environmental Sciences. Butler is the Regents’ Professor of Geography Emeritus in the Texas State University System and an AAG Fellow. His research interests include geomorphology, biogeography, natural hazards, mountain environments, and environmental change. In 2023, Butler was awarded the AAG Lifetime Achievement Award for his contributions to the discipline.
John Fraser Hart, a towering figure in American geography whose career spanned more than seven decades of active research, teaching, and service to the profession, passed away October 14, 2024, in Madison, Wisconsin, at age 100. A meticulous and productive researcher, he authored scores of articles that appeared in the leading journals of geography. Among his books were The Look of the Land (Prentice Hall 1975), The Land that Feeds Us (Norton 1991), and The Changing Scale of American Agriculture (University of Virginia 2003).
Born and raised in southern Virginia and educated at Emory University (A.B. 1943), he returned following his wartime enlistment in the U.S. Navy and enrolled in classes at the University of Georgia in Athens. There he encountered academic geography and was soon recruited into the profession by the department head, Merle Prunty. Hart went on to Northwestern University, earning his Ph.D. in 1950, and also served on the faculty at Georgia.
The research to which he returned time and again over his long career focused on the land and how people used it. His doctoral dissertation, on hill sheep farming in southern Scotland, was a masterpiece of insight and sensitive description. As the years passed, Hart focused his research almost exclusively on the United States and he became increasingly drawn to questions of economic modernization on the farm. He was early to recognize the massive changes that were taking place both in Southern agriculture (“Land Use Change in a Piedmont County,” Annals of the AAG 70(1980) 492-527) and the Corn Belt (“Half a Century of Cropland Change,” Geographical Review 91(2002) 525-543).
He also contributed to national policy debates over the conversion of agricultural land to urban use (“Urban Encroachment on Rural Areas,” Geographical Review 66(1976) 1 – 17). Hart showed that land which went out of agricultural production was actually a surplus in terms of what was needed to maintain farm production. Urban uses were a comparatively less important reason for land conversion. His studies of land use change on the urban fringe typically involved field work and, more often than not, led to lasting acquaintances with the individuals whose farms he studied.
He served on the faculties at Indiana University (1955-1967) and the University of Minnesota (1967-2015) while making prodigious contributions to the American Association of Geographers and to the profession in general. From 1970 through 1980 he was editor of the Annals of the AAG, and regional councilor, vice president, and president of the AAG. In his AAG presidential address, “The Highest Form of the Geographer’s Art” (Annals of the AAG, 72(1982) 1-29, Hart made the case for why regional study has been so important in geography and why it should continue.
Fraser Hart remained a steadfast advocate for geography, geographers, and good scholarship throughout his career. He was a visible, approachable presence at every AAG annual meeting and at West Lakes and Southeast Division meetings until he was past his 90th year. When he retired from the University of Minnesota in 2015, he was the last member of the university’s faculty who had served in World War II.
He was predeceased by his wife, Meredith, and is survived by his children Laird (Kathie) Hart of Washington, D.C., and Anne Hart (Andy van Duym) of Madison, Wisconsin, and by his grandchildren, Dirk and Raina.
This memorial was contributed by Dr. John C. Hudson, professor emeritus of geography, Northwestern University.
Geography in the News is an educational series offered by the American Association of Geographers for teachers and students in all subjects. We include vocabulary, discussion, and assignment ideas at the end of each article.
Cranberries (Vaccinium macrocarpon) are a big part of the winter holidays. Native to North America, they grow in bogs and wet areas from New England to the upper Midwest and Canada. Some also grow in the Appalachian Mountains. A cousin species, V. oxycoccos, grows in Europe.
Cranberry vines grow best in sandy, organic, acidic soils. They prefer cold winters and cool summers. Massachusetts was once the leading producer, but is now outpaced by Wisconsin. Other states where the berry is grown are New Jersey, Oregon, and Washington. In Canada, too, cranberry farms are found in British Columbia and Nova Scotia.
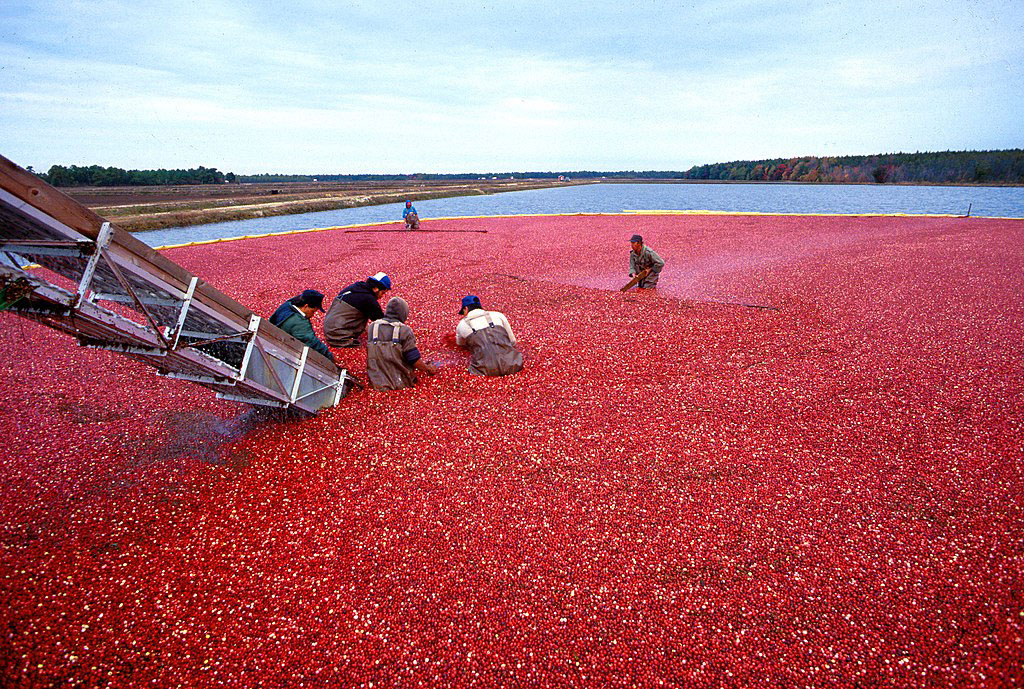
The vines take at least three years to spread and form a mat before bearing fruit. In September, as berries ripen, the farmers flood their fields and use a thrashing machine to scoop berries from the vines. Once they float to the water’s surface, the berries are collected for market.
Cranberry harvest in New Jersey. Source: Agricultural Research Service
Only 5 percent of the berries go to the market fresh. Most are frozen whole, canned, or bottled as juice. Most people buy more cranberry sauce, juice, and even cranberry health supplements than fresh cranberries.
It was not always this way. For centuries, wild-growing cranberries were harvested by the many nations of the Algonquian people who continue to inhabit all of New England and much of the Midwest and Eastern Canada. They call the berry sassamenesh, and harness its power as a superfood. (Cranberries are full of Vitamin C and other nutrients.) One recipe is pemmican, which mixes the berries with dried fish or meat and tallow. Pemmican was the original power bar: it is formed into cakes and baked in the sun. This provides fat, carbs, and nutrients in a form that is easy to carry and store for months.
Demand for Cranberry Grows Fast
For a plant that takes years to bear fruit, the cranberry is otherwise growing fast. Its market expands every year. Cranberries are an important import to other countries, and it is now seen as a food for all year long, particularly for its health benefits. Shoppers have come to expect dried and fresh cranberries in many products, from baked goods to cereal to energy bars. This expansion was driven by a shrewd international marketing strategy from a nearly century-old grower-owned cooperative, Ocean Spray Cranberries, Inc.
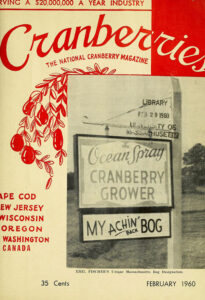
Cranberries: The National Cranberry Magazine, 1960, one of Ocean Spray’s many marketing efforts to get more cranberries into kitchens and on tables. Source: Wikimedia
Ocean Spray began as a small farmers’ cooperative in 1930. By 1988, the company controlled 85 percent of the world’s cranberry market. The key to their success was smart decisions in both marketing and production. Ever eat a “craisin”? This dried version of the fruit was a snacking breakthrough in 1981. By then, Ocean Spray was already famous for its juices. Soon, it was putting cranberries in cereals, energy bars, and desserts.
As demand for cranberries shot upward, competitors got into the game. Private companies made high offers to farmers, hoping to lure them from Ocean Spray. Still, Ocean Spray remains the dominant player, and certainly the most recognizable in the grocery store. It represents about 700 family-owned cranberry farms.
America’s cranberry farmers produce about 8 billion barrels a year. Most come from Wisconsin, which had one of its strongest harvests yet in 2024. It’s almost the perfect place for these unique berries, with plenty of water, sandy soil, and ideal weather. That doesn’t mean they are always a sure thing, however. There is a margin of risk every year. “I like the challenge,” said John Stauner, owner of James Lake Farms in Wisconsin. “It’s a profession where you have a lot of variability throughout the year.”
The weather has always created uncertainty for farmers. Climate change is adding to their worries. In the past decade, Massachusetts bogs experienced flooding from both ocean saltwater and torrential rain, killing some bogs. On the other extreme, a 2022 drought also took a heavy toll on production.
Cranberry bogs are part of the climate solution in New England, too, at least after they have run their course producing the fruit. Although one in four bogs that have gone out of business in Massachusetts, some farmers are using their land for large-scale restoration to protect wildlife and wetlands in the state.
Some cranberry production has headed overseas since the 1990s. A California company invested $20 million in building cranberry bogs in Chile. The investment has made Chile the third biggest cranberry producer worldwide. The United States remains the world’s top producer.
Some years ago, the geospatial firm Descartes Labs used radar data and algorithmic machine learning to map America’s cranberry bogs. It wasn’t easy: find out how they did it.
The next time someone passes the cranberry sauce or offers you a glass of cranberry juice, tell them a thing or two about this bright berry’s history, geography, growth habits, and economic value.
And that is Geography in the News, updated November 1, 2024.
Material in this article comes from “Cranberries” (1996), an original article for Geography in the News by Neal Lineback, Appalachian State University.
AAG’s Geography in the News is inspired by the series of the same name founded by Neal Lineback, professor and the chair of Appalachian State University’s Department of Geography and Planning. For nearly 30 years from 1986 to 2013, GITN delivered timely explainer articles to educators and students, relevant to topics in the news. Many of these were published on Maps.com’s educational platformsand in National Geographic’s blogs. AAG is pleased to carry on the series.
Sources Consulted for this Article
Agricultural Marketing Resource Center, Cranberries. April 2024.
What kinds of conditions do cranberries need to grow? For further study outside of this article: Find out more about the regions and places mentioned in this article. For example, what states make up New England? Do all of them have cranberry bogs? Where are British Columbia and Nova Scotia on a map of Canada? How do we define the Appalachians? How do the climates of these places differ, and how are they similar?
What impact has climate change had on cranberry farming? What impacts can old cranberry farms have on climate change and wetlands? For further study outside of this article: What approaches are scientists and farmers taking to protect the cranberry farms, or to convert old farms back to wetland habitat? What scientific tools are they using to measure, track, and address changes they observe?
The Algonquian peoples were the first to use cranberries for health and energy on long journeys. What were the special, portable cakes they made for this purpose, and what ingredients did they use? For further study outside of this article: Find out more about the Algonquian peoples and language groups. What are some of the tribes that speak Algonquian languages (which have different names)? See if you can find out where some of these tribes lived before European colonization, and where they are now. Can you find other food or plant names in Algonquian?
Share
On the Map
Winds of Change
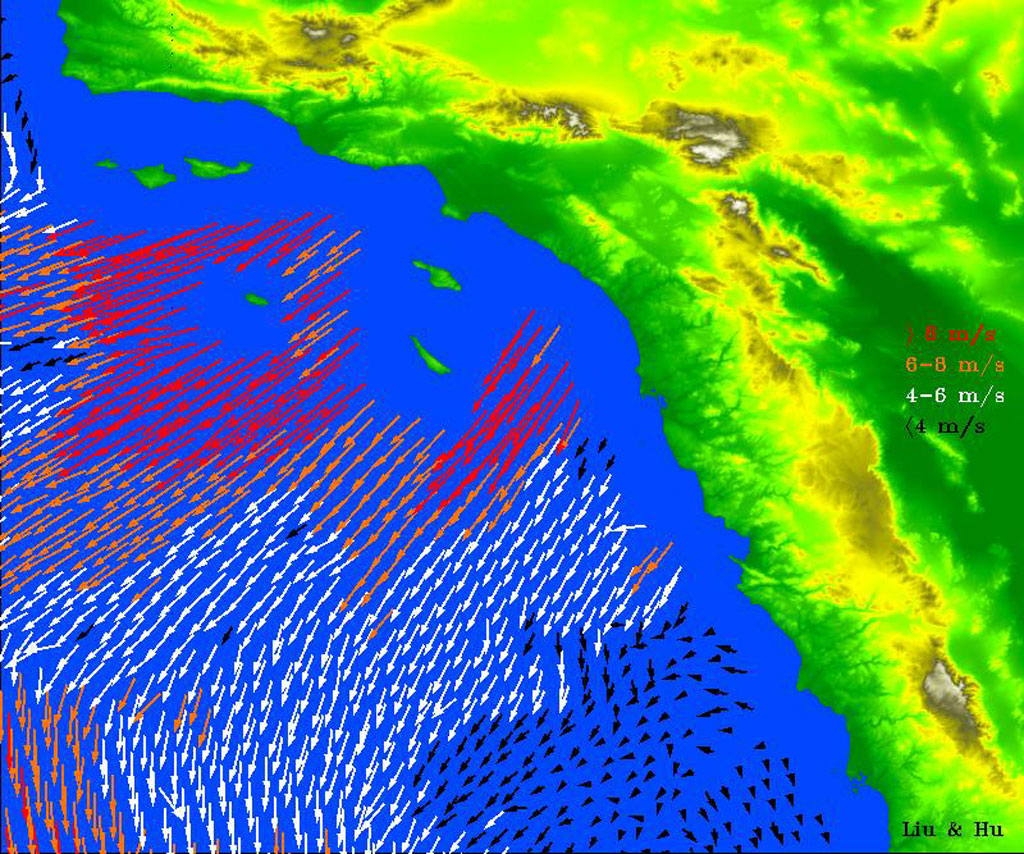
NASA’s QuikSCAT satellite, launched in 1999, shows the Santa Ana winds blowing over the Pacific. Source: NASA
Geography in the News is an educational series offered by the American Association of Geographers for teachers and students in all subjects. We include vocabulary, discussion, and assignment ideas at the end of each article.
Powerful Santa Ana winds often make the headlines in Southern California. They have brought traffic to a standstill on freeways, with wind gusts up to 80 mph (129 kph). They create dust storms and deplete the soil. Sometimes the winds are strong enough to topple trucks and blow down trees. Worst of all, they can power wildfires.
Also called “devil winds,” the Santa Ana winds blow down from the Santa Ana mountains, the Colorado Plateau and the Basin and Range in Utah, Arizona, and Nevada. The winds blow across westward across the coast and into the Pacific Ocean. They happen in the deadly dry season of autumn wildfires in Southern California. In October 2023, Santa Ana winds whipped up a small grassland blaze into the devastating Highland Fire. The fire grew from 14 acres to more than 2,400 acres before it was contained a week later.
Santa Anas are katabatic winds. Also called “gravity winds,” they blow out of high-pressure cells in the mountains. They can be any temperature. The bora winds of Italy and Slovenia are cold, while the Santa Ana winds and their cousins in France, mistrals, are usually hot. In Japan, the katabatic wind is called the oroshi. In Switzerland, it is the foehn.
NASA’s QuikSCAT satellite, launched in 1999, shows the Santa Ana winds blowing over the Pacific. Source: NASA
The high-pressure air mass at the heart of a katabatic wind begins over mountains or high plateaus. As dense air rushes outward from the center of the high-pressure area, its weight causes it to hug the ground. Wind velocity increases as gravity draws it toward the lowlands. When the Santa Ana wind descends in elevation, it also heats up through adiabatic warming, as it compresses, with no exchange of heat from the surrounding air. The typical rate of warming is 5.5 degrees Fahrenheit per 1,000 feet (1 C./100 m.) of descent. The Santa Ana winds can be as hot as 100 F by the time they reach sea level.
Katabatic winds are very, very dry, with humidity of less than 10 percent. In California, this adds to their dangers. Their gusts dry out vegetation and disturb loose soil. While many native California plants are adapted to these conditions, non-native grasses and undergrowth are not. This has contributed to fire hazard, along with some forest management practices that were, ironically, meant to stop fires.
An Ill Wind
“There was a desert wind blowing that night. It was one of those hot dry Santa Anas that come down through the mountain passes and curl your hair and make your nerves jump and your skin itch.”
—Raymond Chandler
The Santa Ana winds are a dramatic player in literature and lore. Their dry, usually hot temperament contributes to an image of Los Angeles as mysterious and sultry, with a hint of menace. Culture critic Mary McNamara compares the winds to living on the surface of Mars. She says, “The Santa Anas are exhausting, and no one does well when they are exhausted.” Writer Joan Didion said, “It is hard for people who have not lived in Los Angeles to realize how radically the Santa Ana figures in the local imagination.” These howling dry winds do seem to define autumn in southern California, buffeting houses and cars and carrying dust and debris. To be fair, they also usher in some of the area’s best surfing waves, and can extend summertime weather at the beach.
Will Climate Change Affect the Winds?
A 2019 study observed that the frequency of Santa Ana winds has decreased in the last twenty years, due to climate shifts. In the early and late parts of the Santa Ana’s season, there are fewer winds than in the 20th century. During the peak from November to January, there hasn’t been much change.
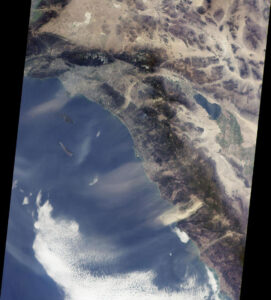
Southern California Santa Anas photographed from space. Source: NASA
Since that first study, the authors have discovered a cold version of the Santa Ana winds that forms differently and has less threat for wildfires. Either type, hot or cold, is associated with temperature extremes in the region. Southern California’s hottest and coldest days have been when these winds happen. Yet the cold type has become much less frequent since the 1940s. “In that case,” says the study’s lead author Alexander Gershunov. “We’re not seeing any positive news in terms of future wildfire seasons.” Gershunov and his co-researchers hope that their work can contribute to early-warning systems for the hot winds to come.
And that is Geography in the News, updated November 1, 2024.
Material in this article comes from “How an Ill Wind Blows” (1996), an original article for Geography in the News by Neal Lineback, Appalachian State University.
AAG’s Geography in the News is inspired by the series of the same name founded by Neal Lineback, professor and the chair of Appalachian State University’s Department of Geography and Planning. For nearly 30 years from 1986 to 2013, GITN delivered timely explainer articles to educators and students, relevant to topics in the news. Many of these were published on Maps.com’s educational platformsand in National Geographic’s blogs. AAG is pleased to carry on the series.
What geographic feature are the Santa Ana winds znamed for? What type of wind are they? For further study outside of this article: How much can you discover about katabatic winds?
How does NASA’s QuickSCAT radar scatterometer get information about wind and ocean currents? For further study outside of this article: What kind of tools and techniques do geographers, meteorologists, oceanographers, and other earth and space scientists use to measure and track winds?
Apart from the Santa Ana winds, what are some of the other conditions and environmental elements that can aggravate wildfires? For further study outside of this article: What techniques, new and old, are used to control wildfires?
Share
John (Jack) Ives
October 15, 1931-September 15, 2024
The mountain geography community mourns the passing of one of its most significant exponents, the bearer of a monumental scientific world in favor of mountain research and development worldwide. Jack D. Ives died on September 15, 2024, at age 93.
As academicians Vladimir Kotlyakov and Yuri Badenkov (2024) indicated, “Professor Jack Ives is a living legend of mountain geography in the second half of the 20th century and the beginning of the 21st. His name is well known not only among scientists, politicians, public figures, but the inhabitants of many mountain settlements of the world, from the Himalaya and Pamir to the Andes and European Alps, from Scotland and the Caucasus to Iceland and China.” In 2015, Bruno Messerli said that Jack “devoted his life not only to mountain research, but also to mountain development, on behalf of the people and communities living in mountain areas.” He drew attention to the plight of indigenous peoples living in mountainous regions and advocated for their inclusion in policy-making processes concerning their lands and resources. His work went beyond academia, influencing international policy on the livelihoods and rights of mountain people.
Jack Ives’ long-term work at the International Geographical Union has played an important role in shaping the global discourse on mountain environments. In 1972 he took over the chairmanship of the Commission on High Altitude Geoecology from then-president Carl Troll, who had established the Commission during the 1968 International Geographical Conference in New Delhi. Jack then alternated with his colleague Bruno Messerli until 1996. This role drew him increasingly into mountain studies. He left an indelible mark within the IGU, in promoting geographical research on mountains and sustainable development. Under his leadership, the Commission focused on interdisciplinary research and worked to improve global understanding of the importance of mountain ecosystems. In this context, in the 1970s Ives became particularly interested in environmental issues in the Himalayas. The increasing international focus on environmental degradation in mountainous regions, such as deforestation, soil erosion and the impact on local communities, led him to advocate for sustainable mountain development. His 1989 book The Himalayan Dilemma: Reconciling Development and Conservation, co-authored with colleague Bruno Messerli, challenged the prevailing understanding of environmental degradation in the Himalayas and changed the trajectory of conservation policy in the region. This work marked a turning point in mountain research and policy and established Ives as a leading figure in the advocacy of mountain sustainability. He played an important role in making mountains a key element in global environmental policy, especially at the Earth Summit in 1992. He was instrumental in shaping the globally recognized “Mountain Agenda” for UNCED at Rio. This agenda called for greater attention to mountain ecosystems and their importance for biodiversity, water resources and human livelihoods. His efforts helped to establish the concept of “sustainable mountain development”, which remains a guiding principle in the field today. Since then, his leadership brought mountain issues to the forefront of the global environmental agenda.
His name is linked to the creation of the International Mountain Society (IMS) and the leading journals of the discipline: Mountain Research and Development, and Arctic, Antarctic, and Alpine Research. He developed “Project 6 (Mountains) of the UNESCO Man and the Biosphere” on “Human Impacts on Mountain Ecosystems” with Bruno Messerli and were key in catalyzing a group of mountain geographers into what he called amicably “the Mountain Mafia” as the movers-and-shakers for the advocacy that culminated incorporating Chapter 13 (Mountains) within the United Nations’ agenda for sustainable development (Agenda 21). They also coedited a book considered by most mountain geographers as the “bible” for mountain studies at the global level in 1997. Mountains of the World: A Global Priority became the framework to start conservation projects, academic projects and international organizations in favor of mountains. The book was translated to many languages with regional appeals. They were also key in formulating the UN-declared 2002 as the “International Year of Mountains” and thereafter November 11th, as “International Mountain Day.”
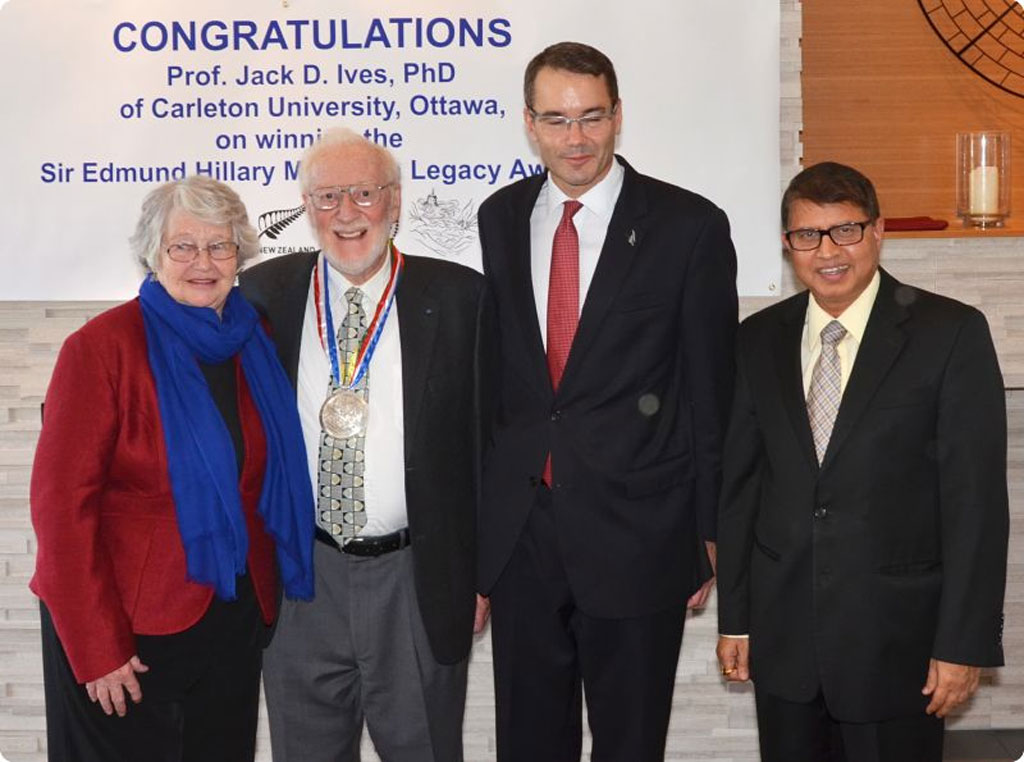
Jack D. Ives’ numerous studies and pioneering initiatives with the United Nations Environment Programme (UNEP), the Mountain Agenda including the International Union for Conservation of Nature (IUCN), ICIMOD, and FAO have been instrumental in shaping international policy on mountain conservation, and his work within the IGU has helped to raise awareness of the academic importance of mountains in global development agendas, drawing attention to the unique challenges facing mountain ecosystems and communities worldwide. He has been honored with many awards, including the King Albert I Gold Medal (2002), the Royal Geographical Society Patron’s Medal (2006), the Icelandic Knight’s Cross of the Order of the Falcon (2007), and two separate Distinguished Career Awards from the Association of American Geographers. The inaugural Sir Edmund Hillary Mountain Heritage Medal Lifetime Achievement Award (2015) was presented to him to recognize lifetime achievement in mountain research and development.
Presentation of 2015 Lifetime Achievement edition of the Hillary Medal, October 29, 2015. L to R: Pauline Ives, Jack Ives, Simon Tucker, New Zealand High Commissioner to Canada, Kali Prasad Pokhrel, ambassador of Nepal to Canada.
He received the Honorary Membership to the Commission of Mountain Studies with a diploma conferred at the 35th International Geographical Congress in Dublin, Ireland just this past summer in 2024, recognizing his fertile and restless work on mountain research and studies. The Diploma, decorated with a gaze from Alexander von Humboldt (Jack’s inspiration) recognizes his pioneering spirit and fruitful work, which will continue to illuminate the path for future montology.
Jack had been the one to suggest the laying of a bronze plaque honoring Humboldt as “the father of Montology” on a cairn at the snowline of Mt. Chimborazo in Ecuador, in December 1998 after the III International Symposium of the Andean Mountains Association (AMA). Indigenous community members, along with Christoph Stadel, Larry Hamilton, Maximina Monasterio, Robert Rhoades, Fausto Sarmiento, the Chimborazo Fauna Reserve administrators, and others, shared in Jack’s admonition that could well be the corollary of his monumental and passionate lifelong advocacy: “For a better balance between mountain environment, development of resources, and the well-being of mountain peoples.”
Colleagues and those who worked closely with him often emphasized his generosity, both in terms of his time and his willingness to mentor and support young mountain geographers. They also admired his ability to blend scientific research with activism as he sought to bring practical, policy-oriented solutions to the environmental problems he studied. It is comforting to know that many of his students, following the exemplary work of this giant, helped to cement transdisciplinary mountain research and study, becoming themselves champions of mountain geography works. Many of them are already retired from teaching, but proudly continue Ives’ model inspiring mountain lore contributing effectively to enrich the genealogy of montology with their emeritus wisdom. After Ives’ retirement, as scholarly recognition of brilliant mentors in academia, a Festschrift was published in his honor (Mainali & Sicroff, 2016) with an apropos title: Montologist.
Now that the discipline of Montology has been firmly positioned as the transdisciplinary mountain research and study, the image of Jack D. Ives will be forever reflected in the deep understanding of mountains as socioecological systems, where consilience and convergence favor decolonized scholarship of mountains, integrating the local knowledge and making real the critical biogeography and political ecology of the many dilemmas that still pervade militarized, marginalized, and exploited mountain communities in the world’s mountainscapes (Sarmiento 2020). It is with a heavy heart that the Commission of Mountain Studies of the International Geographical Union received the news of his passing, but it is with a hopeful spirit to commit maintaining Jack D. Ives’ lofty goals for the mountains alive and well!
References
Kotlyakov V.M., Badenkov Y.P. (eds). 2024. “History and evolution of the UNESCO MAB-6 mountain project human impact on mountain ecosystems: From ecology to montology.” Preface by Jack D. Ives to the book. Mountain Regions of Russia at the Turn of the Century: Research and Development. Problems of Geography Series, volume 158. Moscow: Media Press.
Mainali K, Sicroff S (eds).2016. Jack D. Ives, Montologist: Festschrift for a Mountain Advocate. Himalayan Association for the Advancement of Science. pp. 94–97. ISBN978-9937-0-1567-7.
Sarmiento, F.O. 2020. Montology Manifesto: echoes towards a transdisciplinary science of mountains. Journal of Mountain Science,17(10): 2512-2527. https://doi.org/10.1007/s11629-019-5536-2.
This memorial was prepared by Fausto Sarmiento, Professor of Geography and Director of the Neotropical Montology Collaboratory at the University of Georgia; Neslihan Dal, Lecturer, Department of Architecture and Urban Planning at Burdur Mehmet Akif Ersoy University; Alexey Gunya, Professor of Geography at the Russian Academy of Sciences; and Christoph Stadel, Emeritus Professor of Geography, at the University of Salzburg.
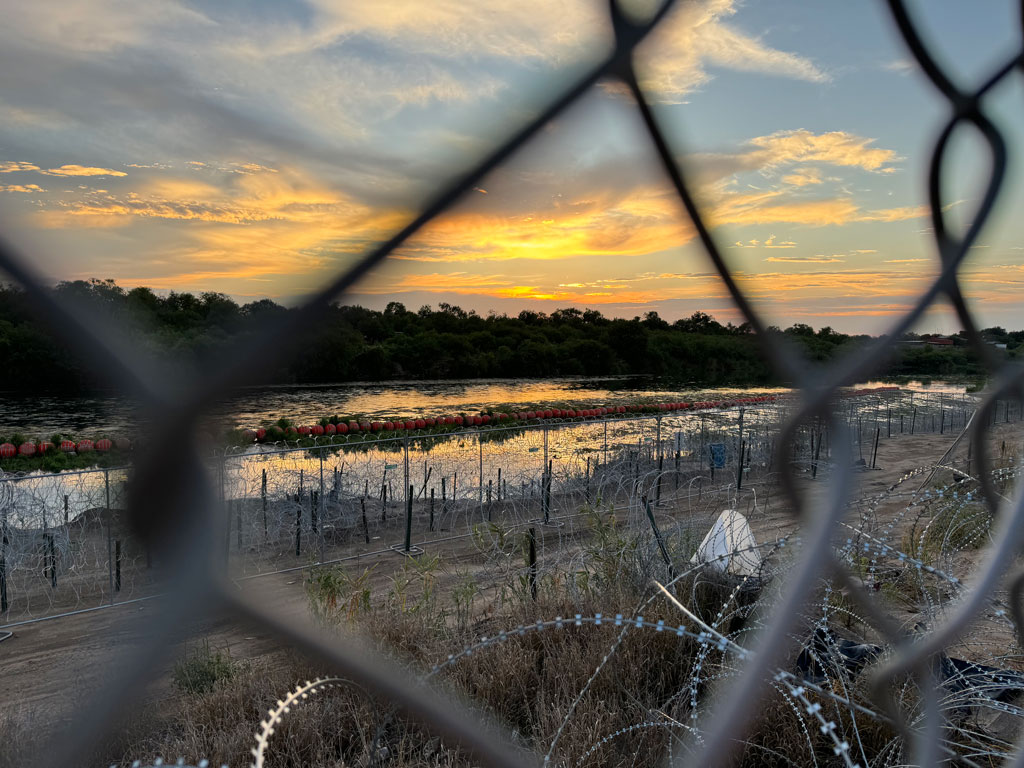
View of the Rio Grande and border; courtesy Adriana Martinez
Adriana (Didi) Martinez knows that the only thing more important than scientific understanding is the ability to share and act on that understanding with a community. As a physical geographer who studies the dynamics of rivers—a fluvial geomorphologist, to be precise—she is trained to find out what helps rivers flow and how human forces can help or harm them. In recent years, studying one of North America’s most beautiful and embattled rivers—the Rio Grande—Martinez has worked to make sure her own knowledge flows, too.
Martinez spent her childhood beside this mighty river that both divides and unites the U.S. and Mexico. She knows both sides of the border, which as a kid she and her family often crossed from her hometown of Eagle Pass to the sister city of Piedras Negra (home of the first-ever nacho in 1943!). The banks of the river that once afforded Martinez idyllic time for play and curiosity are now marred by militarized barriers and the human suffering and habitat destruction they cause. Although her career had taken her far away—to Oregon, and now to southeastern Illinois—Martinez never lost connection with her hometown, and has returned there to do fieldwork on the impact of human activity on the river.
It was this return that made her curious about public scholarship—a scholar’s commitment to bring their learning to the public. Her interactions with family and community members, activists, and sometimes migrants themselves, who approached her for help as she did her work, all have convinced her to translate her knowledge into public awareness and action.
It would be so much easier to stay on the side of “pure” science: ”I’ve cried more than once in the field,” she admits, of her decision to confront the human truths of the Rio Grande, and their effect on its ecosystem. “Growing up on the border, there is an inherent cross-cultural mindset that I grew up with. Both the U.S. and Mexico side are home, they aren’t separated from each other,” she says. “And in the same way, the human is not separated from the river. They are linked to each other. The river provides recreation, water, and fertile soil. And the humans impact the river by crossing it on the international bridges, fishing, using it as a water source, etc. I think the same way about studying geography in that we must look at both sides – the human and the physical. Things can’t be separated.”
Vast Possibilities of Geography
Martinez was already considering graduate school when her passion for geography became clear. “Most of the courses I enjoyed at the undergraduate level were in the geography department at Texas A&M. And as I got to know more geographers and interact with those professors, I realized the value that a geographic lens can bring to research – you can examine the interaction between multiple subdisciplines. For example, look at how humans impact some physical geography aspect of how vegetation influences sediment transport. You don’t have to study just one thing or the other. And I think that in order for research and science to remain relevant we must be looking at these intersections. Particularly in an ever-complicating world where things like climate change are altering landscapes in unexpected and irreversible ways.”
Martinez worries that public scholarship is misunderstood and undervalued at the very time it is most needed. This is especially true for physical geographers like her. “Highlighting my work has become extra important to me, and I realized I actually do more public scholarship than I think I do!”
Martinez also devotes serious time to gathering students and colleagues for field opportunities and research projects. “I seem to excel at bringing people together,” she says. “Either connecting people to expand their networks or giving them ideas on how to reach wider audiences with the projects they are working on. Along that vein, I like to help students realize their potential in science and the geosciences. I want to increase diversity and inclusion in the geosciences.”
“Elevate helped me gain confidence in my skills at being interviewed by reporters,” she says. She has since given numerous interviews and has appeared on local and national television, speaking to both the ecological and human costs of the State of Texas’s border barriers. Through Elevate, she says, “I am no longer going in blind, I have some background knowledge about media and policy.”
“Being able to solve the major problems we are tasked with—ecological and social—is going to take an interdisciplinary approach,” Martinez says. “Geography is just that. It’s just that most people haven’t realized it yet!”
Share
News
Climate Action Task Force Becomes a Permanent Committee
Culminating five years of work to address the carbon impact of the AAG annual meeting and other activities, the Climate Action Task Force has been approved by Council to transition to a permanent committee. In its new capacity, the Climate Action Committee will continue to monitor and address the climate impacts of AAG’s efforts.
The committee was established as a task force in 2019, as the result of a petition signed by over 200 members of AAG, asking the association to take concrete steps toward reducing greenhouse gas emissions related to its activities. A focal point of this request was the AAG annual meeting. Reflecting the recommendations of the IPCC 2018 special report, the petition asked that the AAG cut emissions by 45% by the year 2030 and reach net zero levels by 2050. The petition laid out specific actions that AAG should take in experimenting with low-carbon conferencing and in establishing a systematic measurement and auditing system to emissions related to the annual meeting.
Since then, the committee has collaborated closely with AAG Council and staff to create and implement AAG’s first-ever road map for reducing emissions from the annual meeting. Over the past several years, and in the face of unexpected challenges like COVID-19, the committee gathered recommendations from members, studied the actions other organizations took to reduce their carbon footprints, and helped AAG enact steps to innovate in every aspect of its plans for convening. Among many innovations the committee has introduced are the sponsored local nodes for remote attendance at the meeting, ways to address hybrid and remote convening, and approaches to measuring impact.
Specific accomplishments of the committee to date:
Supported AAG’s rapid move to a virtual format in 2020 as the pandemic began;
Consulted with AAG on the “Regions Connect” coordination effort to conduct virtual regional division meetings in 2021;
Organized special sessions for the AAG annual meeting in 2020, 2021, and 2022, including keynote speeches by Kevin Anderson (2020), Naomi Klein (2021), and Debbie Hopkins (2023), and a 2021 roundtable conversation with members of the Society for Cultural Anthropology, who have organized nearly-carbon-neural conferences, beginning in 2018;
Conducted a survey of association members regarding the AAG annual meeting and climate change; this survey indicated that a strong majority (67%) was in favor of reducing carbon emissions related to the annual meeting;
Development of a double special issue of the Professional Geographer in 2022 (Volume 74, Issue 1) aimed at imagining alternative, low-carbon futures for the AAG that are environmentally and socially just;
Organized two inaugural regional nodes for the annual meeting in 2023, one held across three universities in Montreal and another organized in the Geography Department at CSU-Fullerton; this effort expanded to eleven nodes in 2024; and
Worked with AAG staff to experimented with virtual networking;
The questionnaire that the committee worked with AAG to conduct has also led to AAG’s full divestiture from fossil fuel-driven investments in 2023.
The Climate Action Committee has provided an important forum for discussion of the responsibility for climate action within academia. In addition to the presentations and convenings noted above, publications have included the Professional Geographer special issue, and the documentation of the 2023 plenary lecture and forum in a special issue of ACME: An International Journal for Critical Geographies.
This questionnaire also affirmed AAG’s decision last year to move from its former headquarters on 16th Street in Washington, DC to a more energy-efficient, LEED Gold and Energy Star certified office suite on Pennsylvania Avenue, near the White House. Remarkably, the cost to maintain the new office is equivalent to the cost of owning and managing the old building, while also adding accessibility, energy efficiency, and larger conference spaces.
“Partnering with the task force has helped the AAG make rapid progress on every aspect recommended by the member survey – we couldn’t have done it without their support and guidance,” says Executive Director, Gary Langham.
Results from a survey of AAG members. Among the 93% who urged AAG to take leadership on climate change, the top suggestion was that AAG take a role in policy and advocacy for climate action.
As a result of the work of the work by members of the task force and committee, the AAG has committed to attaining the goals set out by the original petition and has taken multiple actions to reach them. Fulfilling these goals (45% carbon reduction by 2030 and net zero by 2050) will be challenging. As the Climate Action Task Force shifts to the standing Climate Action Committee, the center of its work will be to find ways to help AAG and its members make a real and sustained transition to low-carbon conferencing and other professional practices.
For information on additional actions AAG undertook in response to or confirmed by the questionnaire, see executive director Gary’s Langham’s overview. Check the 2020 Task Force Report and 2021 Task Force Report for more fundamental information on the Climate Action Committee’s first five years.
AAG would like to thank all the continuing members of the new committee who will maintain their involvement and Wendy Jepson, co-founder and past chair of the Task Force, to whom we owe a tremendous debt for her time and expertise.
AAG Climate Action Committee Members
Pam Martin (co-chair)
Betsy Olson (co-chair)
Dydia DeLyser
John Hayes
Rebecca Lave
Joe Nevins
Tom Ptak
Shaina Saidal
Ryan Stock
Farhana Sultana
Emily Yeh
Staff Members: Oscar Larson, Elin Thorlund, Gary Langham
AAG Members get exclusive access to publications, prominent journals, unique advocacy, grant, scholarship and professional opportunities with access to industry focus communities, and event discounts, including our annual meeting.
Some content may only be accessible if you belong to specific Specialty or Affinity Groups. You can still update your membership below. You will need to go through the Join flow, but you do not need to repurchase your membership unless it is expired or about to expire.
To provide the best experiences, we use technologies like cookies to store and/or access device information. Consenting to these technologies will allow us to process data such as browsing behavior or unique IDs on this site. Not consenting or withdrawing consent, may adversely affect certain features and functions.
Functional
Always active
The technical storage or access is strictly necessary for the legitimate purpose of enabling the use of a specific service explicitly requested by the subscriber or user, or for the sole purpose of carrying out the transmission of a communication over an electronic communications network.
Preferences
The technical storage or access is necessary for the legitimate purpose of storing preferences that are not requested by the subscriber or user.
Statistics
The technical storage or access that is used exclusively for statistical purposes.The technical storage or access that is used exclusively for anonymous statistical purposes. Without a subpoena, voluntary compliance on the part of your Internet Service Provider, or additional records from a third party, information stored or retrieved for this purpose alone cannot usually be used to identify you.
Marketing
The technical storage or access is required to create user profiles to send advertising, or to track the user on a website or across several websites for similar marketing purposes.

 Michaela Buenemann, incoming editor for Physical Geography, Earth, and Environmental Sciences, is professor and head of the Department of Geography and Environmental Studies at New Mexico State University. Her interdisciplinary, international, and collaborative work features contributions in GIS, remote sensing, spatial modeling, landscape ecology, and biogeography. She has published in a wide range of geography, environmental sciences, and GIScience journals, and her research has been funded by numerous state and federal agencies. In the classroom and field, she teaches an array of courses in physical geography, socio-environmental systems, field methods, geographic information science and technology, and geographic theory and research design. She has contributed to the discipline of geography in various roles, including chair of the Southwest Division of the American Association of Geographers, Southwest Regional Councilor of the American Association of Geographers, and Southwest Regional Councilor of Gamma Theta Upsilon.
 We are grateful to David R. Butler, outgoing editor for Physical Geography, Earth, and Environmental Sciences. Butler is the Regents’ Professor of Geography Emeritus in the Texas State University System and an AAG Fellow. His research interests include geomorphology, biogeography, natural hazards, mountain environments, and environmental change. In 2023, Butler was awarded the AAG Lifetime Achievement Award for his contributions to the discipline.
 Adriana (Didi) Martinez knows that the only thing more important than scientific understanding is the ability to share and act on that understanding with a community. As a physical geographer who studies the dynamics of rivers—a fluvial geomorphologist, to be precise—she is trained to find out what helps rivers flow and how human forces can help or harm them. In recent years, studying one of North America’s most beautiful and embattled rivers—the Rio Grande—Martinez has worked to make sure her own knowledge flows, too.