Maps as ‘Materials that Carry Memory’
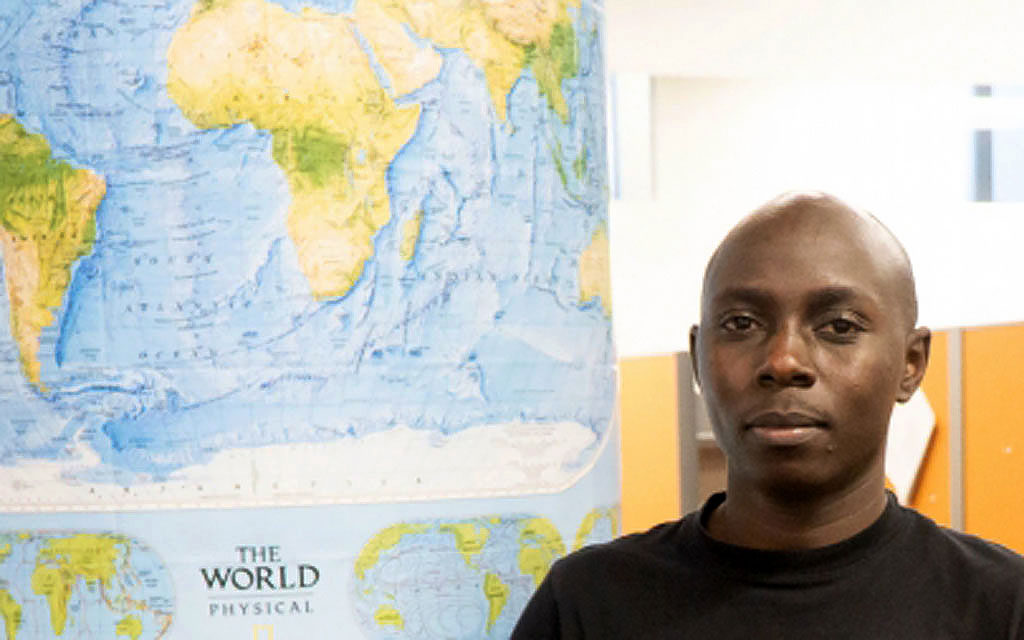
When artist Joanathan Besacci was growing up in Lyon, France, he was surrounded by the vast variety of the world, past and present. His maternal grandmother emigrated to France from Vietnam, and his paternal grandfather was from Kabylia (Northern Algeria). As a child, Bessaci spent hours watching his artist father work and exploring the flea market in Lyon, France, where his grandparents had a stall.
The flea market was a magical place, he says, “a doorway to other worlds.” His memories of it go back to 1986, when it was still called La Fecine, in Villeurbanne, set up on a street closed on Sunday mornings. In the 1990s, it moved to Vaise, and by the end of the decade, it found its current home: Les Puces du Canal.
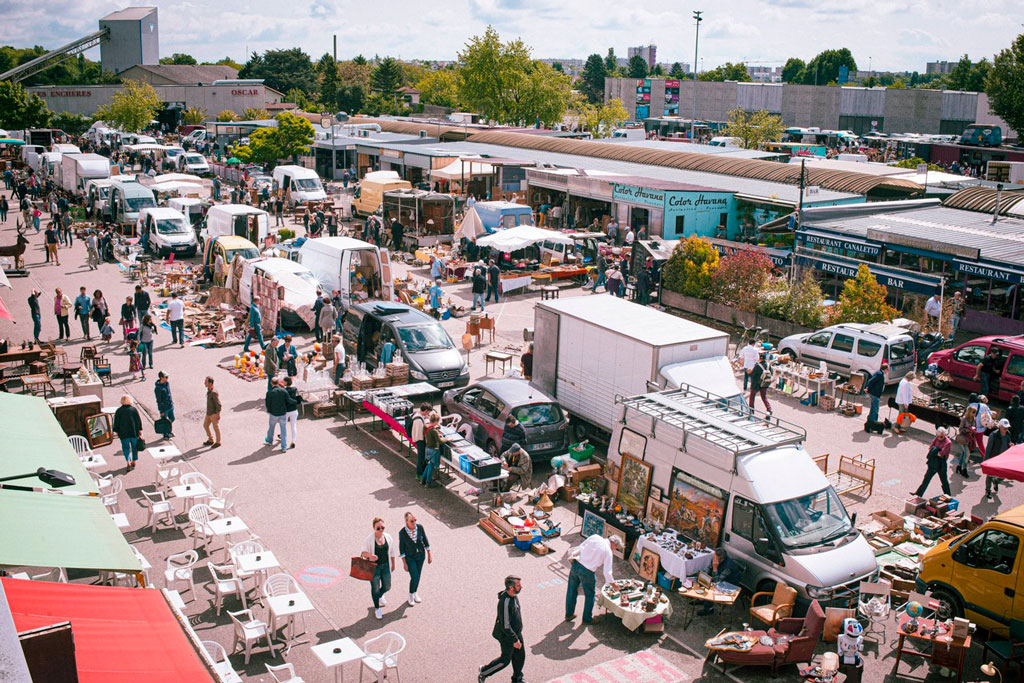
“I went there as a child, still half-asleep but filled with excitement,” Bessaci recalls. “My grandfather arrived as early as 4 a.m.; I followed my father around after 5 a.m. You had to get up early to hope for a good spot. Sometimes sales began right in the trucks, under the flickering light of flashlights, before the sun had even risen.”
It was here that he first discovered the maps, books, and old photographs that now form the essential materials of his art. “They carried stories, past lives, fragments of humanity which, though I didn’t realize it yet, would become the very substance of my work.”
The flea market also influenced Bessaci’s fascination with the riddles presented by old objects and artifacts, “guessing what an object had been used for, what life it had lived, who had touched it before me. In some maps, I find traces of passage—a handwriting, a stain, a tear. These marks of time move me deeply. They make each piece unique, irreplaceable, like an imprint left by history. It is in this intimate relationship with objects, memory, and enigma that my artistic practice took root.”
Bessaci started as a graffiti artist, in his teens. His work evolved over time into the elaborate paper cut-out sculptures, using maps and photographs, that he makes today. At art school, he says, “I discovered the relationship to time. Coming from graffiti, where everything must be done in urgency, I was stunned to learn that a single project could take 80 to 100 hours of work. At first, it was a trial, almost a violence against my rhythm. But little by little, this temporality became an obviousness, a new kind of breathing.”
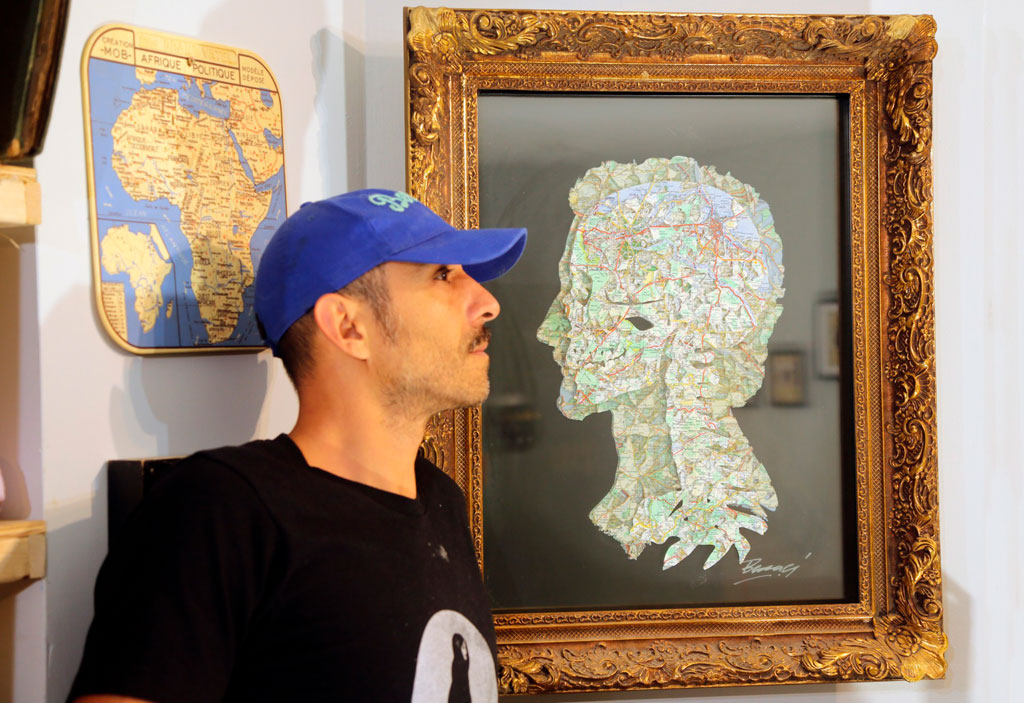
Now based in the United States, Bessaci continues to develop his practice and present his work in exhibitions and art fairs. He draws inspiration from antique Michelin road maps, primarily from the 1920s to the 1970s. He combines them with photographs and vintage textiles to create works that blend the markers of human individuality with topographies and routes. “My process is instinctive, almost archaeological,” he told Bold Journey magazine in 2025. “I collect, cut, layer, stitch. Each gesture is an attempt to surface memory, to retell what we think we already know.”
The maps Bessaci includes in his art create what he calls “layered stories.” The roads and rivers become metaphors for “chosen or imposed paths, uprooted or rediscovered roots.” The cuts, overlaps, and fragmentation he imposes are ways to question his subjects, and to challenge the idea of the subject as fixed. He seeks to portray “something in motion, composed of ruptures and recompositions.”
Bessaci had been primarily a painter for more than 15 years when he shifted his practice these sculptural works on paper. The change coincided with the birth of his daughter, and an extended period of time in a secluded studio in a very small town in France. On a visit to his grandfather at around this time, Bessaci received a box of old items, including old road maps. “It was as if the flea market had returned to my hands, charged with memory and secrets to be revealed.”
At first, Bessaci was reluctant to make any changes to the maps: “The day I dared to cut directly into a map, I felt an inner shift,” he says. “The maps immediately spoke to me: they were at once adventure, travel, and a profound resonance with my family, my memories of the flea market, and this need to explore the traces left by time.”
As Bessaci experimented and refined his technique, he began layering the maps, up to five layers at a time, to explore depth. The more he worked with old maps, the more he saw correspondences with people, and with memory and life itself: “The roads and rivers reminded me of veins, a living cartography of the body and of memory.”
Bessaci describes much of his raised work as bas-relief. He frames his cutouts between layers of glass and road maps, comparing them to mille-feuilles, a many-layered dessert. The layers create depth, “almost a vibration.”
Today, Bessaci owns nearly 5,000 maps, mainly Michelin, dating from 1890 to 1990.
“Their texture, their faded colors, their smell of ink and aged paper fascinate me,” Bessaci says. “A map is a displacement, an adventure, but also an anchor. It helps us know where we are, and I like to believe it also helps us know who we are.”
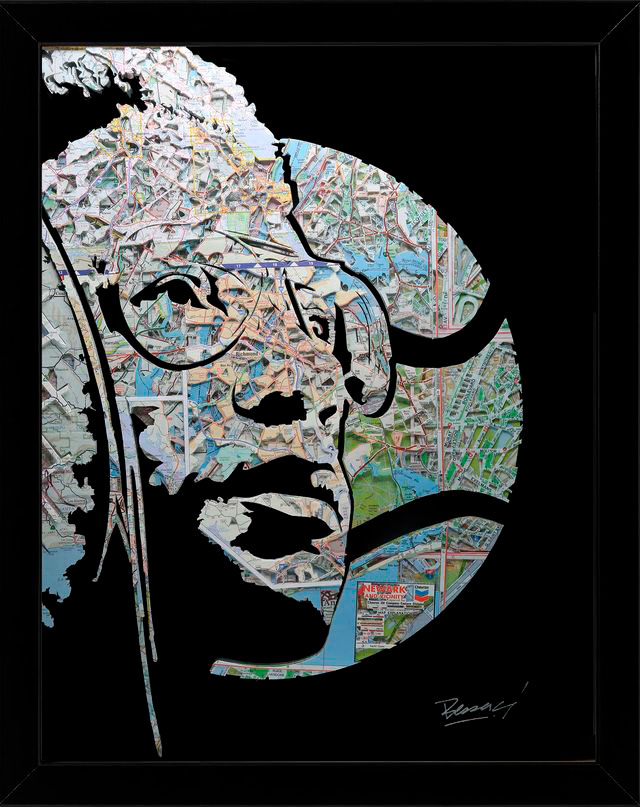
Bessaci is now working on a new series he calls Roots and Paths, using the kinds of photographs that turn up at flea markets, secondhand stores, and estate sales, devoid of their original context and family connections. Bessaci cuts the people from these images, leaving only their silhouettes, emphasizing their gestures. His goal is to neutralize “any visible markers of race, gender, and age, allowing the viewer to project their own memories, their own emotional history.” In place of the removed material, he fills in map fragments—roads, rivers, mountain ridges—as “layers of inner geography.”
He can foresee many years—perhaps a lifetime—of working with maps as an artist. “Maps, more than any other medium, have something magical: I don’t feel like I chose them—they found me,” he says. “They reflect my identity, but also the memory of my family, of places, of stories that shaped me. What I love is that they never fully reveal themselves. They hold secrets, hidden stories. I like to slip clues into my works, and sometimes, years later, a collector tells me: ‘I’ve just discovered this detail.’ At that moment, I feel that the map keeps speaking, long after me, as if it carried its own narrative.”

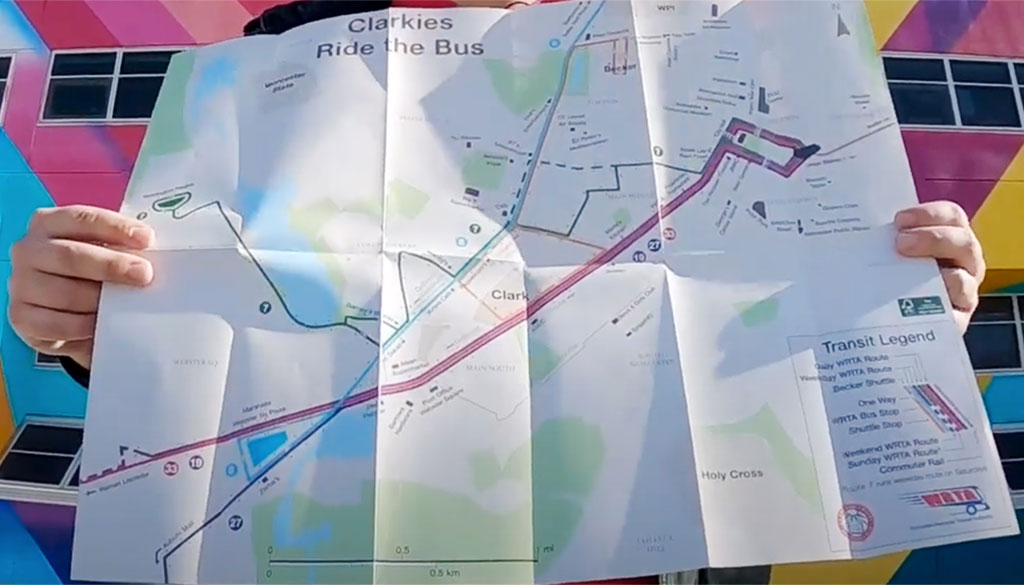
 When Nick Mellis was eight years old, he memorized the New York City subway map. He’s been a map and transit enthusiast ever since, majoring in geography as an undergrad at Clark University, and going on to pursue graduate studies in community and urban planning, also at Clark.