We’re getting closer to the 2021 AAG Annual Meeting! Whether you will be attending the meeting all week, for a few days, or catching up with recordings of presentations between other obligations, there are plenty of ways to get involved using social media. Social media is a great way for seasoned conference goers and newcomers alike to network, report on new research, engage in lively debate with those inside and outside of the discipline, and find out what’s going on during the largest geography conference in the world. Start planning your #AAG2021 social media strategy today with these helpful guidelines:
Twitter
One of the most frequently used social media sites for live events, Twitter is a great place to start scoping out the annual meeting. Twitter is used by geographers to discuss research ideas, share recent publications, or connect with others. As the main social media channel, the AAG annual meeting has had active Twitter users since at least 2011 in Seattle. This year the official conference hashtag will be #AAG2021. Start using and following #AAG2021; posts are already being compiled in anticipation of the meeting. If you are new to Twitter, try these tips to benefit most from the network:
Follow @theAAG on Twitter. The official AAG Twitter account will be active throughout the meeting with important announcements, live tweets of events, and fun ways to virtually interact with other conference attendees.
Use #AAG2021on all your meeting related communications. Sometimes it is difficult to fit your thoughts into the 280 character count, but try to include the hashtag #AAG2021 in each of your tweets. This will ensure that your tweets are being seen by others who are attending the conference or following along. If you are new to hashtags, a hashtag is a way to organize a specific topic into one feed. Click on the hashtag to see the conversations happening related to that topic.
Whenever possible, try to include Twitter handles. If you are tweeting about a paper, panel, or poster, be sure to attribute the research to the right person by using their Twitter handle (@[name]). Presenters and panelists should consider including their handles on an opening slide or in a poster corner. Conversely, if you do not want your research to be tweeted, please state that information upfront so the audience is aware of your desires.
Follow the hashtag and join the conversation! The great thing about Twitter conversations is that they can be both live or asynchronous, helpful for those communicating between time zones.
Facebook
Do you prefer Facebook over Twitter as your social media site of choice? While there will be less live coverage of specific sessions, Facebook is a great way to share videos and news about the annual meeting with your friends, family, and colleagues.
Make sure you like the AAG Facebook page (www.facebook.com/geographers) and set the page so that you see it first in your News Feed by clicking on the “Following” dropdown menu on the AAG Facebook page itself. This will ensure that you receive the latest meeting related announcements as soon as you open the Facebook app or website.
Check on the page each morning for reminders of the day’s schedule of events.
Instagram
Instagram is a fun place to share your photos of your daily life as a geographer and where in the world you are participating from for the AAG Annual Meeting.
Follow @theAAG on Instagram for visual representations of programs currently underway at the AAG.
Share your photos of your personal experience of the annual meeting with other attendees using the conference hashtag #AAG2021.
Linked in
The AAG has recently expanded its presence on the professional networking site, Linked in. New features, such as the ability to write and publish short blog-style posts, has recently set Linked in apart from other social networks. With the ability to share content using hashtags, Linked in is a great network to share research, ask for feedback, and hear from industry thought leaders.
Are you following the AAG’s page on Linked in? Be sure to hit the follow button to ensure that anything posted by the AAG shows up in your feed.
Use #AAG2021 on Linked in as you would with Instagram or Twitter. Hashtags on Linked in work similarly to those on Instagram or Twitter, giving users a chance to follow a long with conversations about a particular topic, in this case, the 2021 AAG Annual Meeting.
Share upcoming professional development events or other items of interest to your Linked in feed using relevant hashtags. By adding hashtags to your posts, more people are likely to see your content.
General Communications
Because the AAG social media channels will be busy during the annual meeting, AAG staff may not be able to provide a timely reply through these mediums. The AAG Annual Meeting Website is a good place to start for conference information with regards to technology related questions, session times, and abstracts. If you have questions or concerns and need to contact a staff member, the best option is to email meeting[at]aag[dot[org].
Share
Annual Meeting
What will be Presented at the 2020 AAG Meeting?
Jeong Chang Seong, Chul Sue Hwang, Ana Stanescue, Yubin Lee, and Youngho Lee
A total of 4,893 papers and posters are scheduled to be presented at the Denver AAG Annual Meeting in April this year (numbers as of February 2, 2020). In order to help meeting participants and fellow geographers to sketch out what is going to be presented at the meeting, we summarized the AAG 2020 presentation submissions using keywords network analysis methods.
We collected all keywords from the presentation submissions. They were preprocessed with deletion, concatenation, standardization, normalization, and conversion techniques. A total of 21,954 keywords were split into single-word keywords. Any duplicate words in each record were also deleted. A total of 6,521 unique keywords were identified. We used 40 as the keyword frequency threshold for network visualization. As a result, a keywords network diagram was constructed with 129 keywords as shown in Figure 1. In the figure, circle sizes reflect keyword frequencies, edge widths indicate co-occurrences between two keywords, and circle colors indicate cluster memberships.
Figure 1. A keywords network constructed with the 2020 AAG presentation submissions
Urban (532) was identified as the most frequent keyword at the 2020 AAG Annual Meeting, followed by GIS (322), Spatial (276), Climate Change (234), Development (218), Water (215), Health (191), Climate (168), Remote Sensing (164), Social (158), and Food (158). Each number in parentheses indicates the frequency of the keyword.
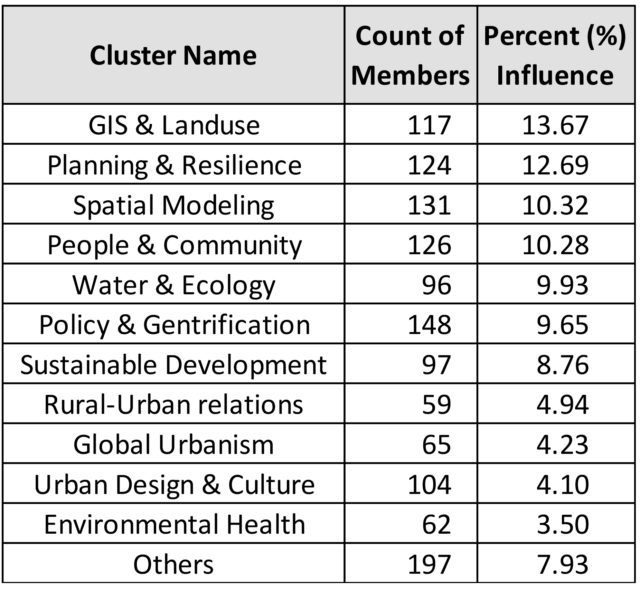
When a keywords network clustering algorithm was applied, keywords were grouped into 12 topical clusters as shown in Table 1. The Urban cluster had the largest number (1522) of keywords as members. When the influence of each cluster was measured with the eigenvector centrality, the Urban cluster was also most influential by taking 28.12% of all possible connections among keywords. When only the Urban papers were analyzed, eleven Urban sub-clusters were identified, and their percent influences and member keyword counts are shown in Table 2. No particular topic stands out in the Urban research. Rather, several topics are very competitive.
Table 1. Clusters of AAG 2020 Presentations
Table 2. Sub-clusters of Urban Research
Some other interesting watch points are also found in the AAG 2020 presentation submissions. Firstly, this year’s 4,893 presentations are significantly less than last year’s 6,026 presentations. Secondly, the Spatial Data Science theme is independent of the GIS theme. It appears to be a much more influential cluster than GIS. Thirdly, the Urban cluster doesn’t seem to be a proprietary estate for traditional urban geographers. It embraces various expertise like GIS, data science and modeling, land use and landcover, water, ecology, and environmental health. Indeed, Urban is rather a solid entity calling diverse geographers. Finally, it will be interesting to see what will happen to the Health, Water, Education, Geopolitics, and Ontology clusters. Will they keep tenures at the AAG 2021 Meeting at Seattle?
Acknowledgment: This research was supported by the MSIT (Ministry of Science, ICT), Republic of Korea, under the High-Potential Individuals Global Training Program (IITP-2019-0-01603) supervised by the IITP (Institute for Information & Communications Technology Planning & Evaluation). We also thank AAG for supporting data for this research, and thank Dr. Coline Dony, AAG Senior Geography Researcher, for encouraging us to submit this article to the AAG Newsletter.
About the Authors
Jeong Chang Seong, Ph. D., is a professor of geography at University of West Georgia (UWG), Carrollton, GA
Chul Sue Hwang, Ph. D., is a professor of geography at Kyung Hee University (KHU), Seoul, South Korea
Ana Stanescu, Ph. D., is an assistant professor of computer science at University of West Georgia, Carrollton, GA
Yubin Lee is a graduate student at KHU who is currently performing a visiting research at UWG
Youngho Lee is a graduate student at KHU who is currently performing a visiting research at UWG
Share
Annual Meeting
AAG 2019 DC Annual Meeting PDF Program
Share
Annual Meeting
2019 Annual Meeting Program: Washington, DC
Share
Annual Meeting
AAG mobile app tip sheet
Share
Post
Social Media at #aagDC
We’re getting closer to the 2019 AAG Annual Meeting! Whether you will be attending the meeting all week, for a few days, or looking to follow the action from afar, there are plenty of ways to get involved using social media. Social media is a great way for seasoned conference goers and newcomers alike to network, report on new research, engage in lively debate with those inside and outside of the discipline, and find out what’s going on during the largest geography conference in the world! Start planning your #aagDC social media strategy today with these helpful guidelines!
Twitter
One of the most frequently used social media sites for live events, Twitter is a great place to start scoping out the annual meeting. Twitter is used by geographers to discuss and share research ideas or connect with others, often leading to face to face meet-ups at the annual meeting. As the main social media channel, the AAG annual meeting has had active Twitter users since at least 2011 in Seattle. The hashtag #AAG followed by the year of the event used to be the standard AAG Annual Meeting tag. However, this year we decided to switch it up! Due to increased traffic from other events who are already using #AAG2019 (hat tip to the ASEAN Autism Games) and the fact that as geographers we are always thinking about place and space, we will now use the hashtag #aag followed by the location of the conference. This year the official conference hashtag will be #aagDC! Start using and following #aagDC; posts are already being compiled in anticipation of the meeting! If you are new to Twitter, try these tips to benefit most from the network:
Follow @theAAG on Twitter! The official AAG Twitter account will be active throughout the meeting with important announcements, live tweets of events, and fun photos throughout the conference hotels. Due to popularity, the AAG will continue to conduct a Twitter poll once a day for members to choose a session they would like to see live-Tweeted!
Use #aagDC on all your meeting related communications. Sometimes it is difficult to fit your thoughts into the (now expanded!) 280 character count, but try to include the hashtag #aagDC in each of your tweets. This will ensure that your tweets are being seen by others both at the conference and following along offsite. If you are new to hashtags, a hashtag is a way to organize a specific topic into one feed. Click on the hashtag to see the conversations happening related to that topic.
Whenever possible, try to include Twitter handles. If you are tweeting about a paper, panel, or poster, be sure to attribute the research to the right person by using their Twitter handle. Presenters and panelists should consider including their handles on an opening slide or in a poster corner. Conversely, if you do not want your research to be tweeted, please state that information upfront so the audience is aware of your desires.
Unable to attend the meeting this year? Follow the hashtag and join the conversation!
Facebook
Do you prefer Facebook over Twitter as your social media site of choice? While there will be less live coverage of specific sessions, Facebook is a great way to share photos, videos, and news about the annual meeting with your friends, family, and colleagues.
Make sure you like the AAG Facebook page (www.facebook.com/geographers) and set the page so that you see it first in your News Feed by clicking on the “Following” dropdown menu on the AAG Facebook page itself. This will ensure that you receive the latest meeting related announcements as soon as you open the Facebook app or website.
Be on the lookout for Facebook Live videos from some of the major events like the Exhibition Hall opening and the World Geography Bowl finals!
Check on the page each morning for reminders of the day’s schedule of events.
Instagram
The AAG’s newest social media channel, Instagram is a fun place to share your photos of activities at the annual meeting and your daily life as a geographer!
Follow @theAAG on Instagram for photos of the annual meeting as well as behind the scenes looks at the work that goes into planning the conference on a yearly basis!
Share your photos of the meeting with other attendees using the conference hashtag #aagDC and look for an Instagram collage of #aagDC photos after the meeting ends.
Want to be featured in our new Instagram Campaign to meet members of the AAG, #MeettheAAG? Look for AAG Staff throughout the meeting who will be taking photos and collecting information about AAG members that will be showcased during the summer.
General Communications
Because the AAG social media channels will be busy during the annual meeting, AAG staff may not be able to provide a timely reply through these mediums. The AAG Annual Meeting App is a good place to start for conference information with regards to floor plans, session times and locations, and abstracts. If you have questions or concerns and need to contact a staff member, the best option is to find a conference volunteer (wearing a neon yellow t-shirt) or to stop by the AAG Meridian or Registration area in the Atrium of the Marriott Hotel.
Share
Annual Meeting
Little Known Tampa: Culturally Diverse and Exciting!
When you come to Tampa, you’ll find examples of good planning, fabulous natural areas, and appealing urban spaces. Here are some things to keep in mind:
Florida and the Tampa Bay area are—or at least were—national leaders in growth management
Beginning in the late 1970s and culminating in the Growth Management Act of 1985, the state of Florida had one of the nation’s most fully articulated statewide planning regimes. Perhaps because Floridians had experienced firsthand the problems of rapid growth without much planning, the state legislature created measures to ensure that each county and municipality engaged in long term planning, that large regional projects were reviewed by regional planning agencies, and that state officials would be charged with upholding plans. Transportation, water resources, and coastal concerns were all taken into account when new developments were proposed. Growth management hardly stopped development – Florida’s population grew from 9.7 million in 1980 to just over 19 million in 2012, with new single family housing accommodating much of that growth. But under the state’s growth management laws, some of the sins of the 1960s and 1970s – houses constructed without attendant municipal services in place, unrestrained draining of wetlands, and inattention to water resource limits – were contained. Unfortunately, important parts of these Growth Management laws were overturned in 2011. The full impact of this retreat has not yet been felt; thanks to the recession, demand for new construction has been limited. But once demand picks up, the flight from comprehensive planning is likely to be felt, especially in the less urban parts of the state.
Tampa Demographics
White or Caucasian (including White Hispanic)
62.9%
(Non-Hispanic White or Caucasian)
46.3%
Black or African-American
26.2%
Hispanic or Latino (of any race)
23.1%
Asian
3.4%
Native American or Native Alaskan
0.4%
Pacific Islander or Native Hawaiian
0.1%
Two or more races (Multiracial)
3.2%
Source: US Census Bureau
Tampa has an industrial history
Incorporated in 1849, Tampa, unlike many Sunbelt cities, emerged as an industrial center. Between 1865 and World War II, Tampa was a key center of the cigar industry. The cities (and now neighborhoods within Tampa) of Ybor City and West Tampa both developed around cigar manufacturing, drawing streams of immigrants to work in the factories. Tampa has a tradition of union activism having experienced several general strikes in the early decades of the last century. Its racially and ethnically diverse population has a tradition of immigrant social clubs and mutual benefit societies that provided cultural and material resources to working class residents. The built legacy of these traditions can be found throughout these communities. The Cuban Club, the German-American Club and the Italian Club are a few of the early 20th century establishments whose buildings have been preserved. And the former cigar factories remain distinctive features of the central Tampa built environment. While some of these sit vacant, others have been repurposed for other industrial uses or converted to condos and offices. Those interested in exploring Tampa history can do so in Ybor City, either by taking advantage of the programs of the Ybor City Museum (www.ybormuseum.org ), or by strolling through the neighborhood.
Tampa has rediscovered its downtown waterfront
Among the most striking characteristics of our area are its water features. Parts of Tampa and all of Pinellas County (location of St. Petersburg) are defined by their rivers, bays and oceans. But until recently, Tampa was largely cut off from its waterfront. In an earlier era, river and bayfront areas were dominated by industrial, port and transportation infrastructure, but as those uses have receded (the Port of Tampa remains quite active, but other waterfront industries are gone), Tampa was slow to recognize the value of its waterfront for recreation and the development of other amenities. One of the major commercial developments in the downtown area, the Channelside shopping/entertainment center, is located directly on the water, next to the Tampa port facilities, and it has been ingeniously designed so that those visiting the development have no contact with the water at all – no access, no vistas. Perhaps that helps explain why the development has gone bankrupt.
But more recent downtown planning has embraced the waterfront location. A “Riverwalk” has been under development now across two mayoral administrations; a recent federal grant will accelerate its completion (www.thetampariverwalk.com ). Those of you visiting downtown Tampa will have the opportunity to enjoy the water at some new locations. The Tampa Bay History Center opens onto a waterfront plaza (https://www.tampabayhistorycenter.org/ ). The newly renovated Curtis Hixon Park, at the other end of the downtown peninsula, is a well-designed, inviting urban space flanked by the newly built Tampa Museum of Art (https://tampamuseum.org/ ). With food kiosks, fountains and children’s play areas, it’s the sort of urban gathering point that this city has lacked for too long. These new spaces signal the success of fledgling coalitions of elected officials, civic activists and business leaders who share an appreciation for appealing design and pedestrian-friendly urban environments.
Ride the TECO trolley
Like too many Sunbelt cities, Tampa once had a dense network of light rail lines, most of which were bought up by bus companies and dismantled by the late 1940s. But a trolley line was resurrected recently; it runs a loop connecting the downtown/Channelside area with Ybor City (https://www.tecolinestreetcar.org/). The embattled trolley line has struggled to maintain ridership; critics claim its empty cars are proof that this region will never embrace mass transit while defenders note that its limited route makes it useful mostly to visitors or the rare resident whose home and work happen to be near one if its stops. But those of you staying at one of the conference hotels are well positioned to use the trolley for your explorations.
There’s much in this area that transcends the generic – the newly opened bike and pedestrian bridge that traverses Tampa Bay along the Courtney Campbell Causeway; one of baseball’s best teams (the Tampa Bay Rays) playing in one of baseball’s worst stadiums (Tropicana Field); the annual invasion of the city by sea led by business and civic leaders dressed as pirates (the Gasparilla Festival) and the annual crowning of a “Strawberry Queen” in nearby Plant City. If you want to learn more about what the region offers, you can read all about it the highly regarded Tampa Bay Times (www.tampabay.com), one of the last independently owned metro area newspapers. We urge you to explore the area and learn that it has a diverse array of historic places, quirky areas, and scenic spots. ♦
The Chesapeake Bay: Destruction and Rehabilitation in the Nation’s Largest Estuary
It’s another drizzly day on the Chesapeake, and the boat we are on bobs gently on the opaque, mud-colored water. A crusty old crabber from Tangier Island, by the nickname of Captain Cook (use of nicknames is an old and strong tradition on Tangier), has just dropped a scraper overboard and brought up a bunch of seagrass, which is dumped on a sorting table in front of us.
rCaptain Cook and the scraper
Our hosts are members of the Chesapeake Bay Foundation, and this is their educational boat. “We” are the crew of Hōkūle‘a, the Hawaiian voyaging canoe that recently circled the globe promoting the message of Mālama Honua—take care of the Earth. I met the canoe in Yorktown, Virginia on May 6, 2016. Two guests were already among us—Kirk Havens, the assistant director of the Virginia Institute of Marine Science, and his cousin Dan Havens from the Washington Canoe Club. We were joined the next night by the mayor of Tangier Island, James Eskridge (“Mr. Mayor”) and Captain Cook. Together we all set out from Yorktown the morning of May 8. As we approached the mouth of the York River, the great grey expanse of the Chesapeake Bay stretched out before us so far that we could not see the other side.
Because it is one of the earliest sites of continuous European settlement in the U.S., and because of the importance of its ecosystem, the Chesapeake Bay is an excellent example of how modern humans have mismanaged nature’s bounty. The Bay is the largest estuary in the United States, with a 64,000-square-mile watershed feeding fresh water into this salt-water inlet, resulting in a range of aquatic and marine ecosystems. “What makes an estuary more productive than coastal areas,” says Paul Willey, Director of Education Operations for the Chesapeake Bay Foundation and one of our hosts on this trip, “is the mix of fresh and salt waters. But what makes the Chesapeake Bay even more productive is that it’s shallow.” Average depth in the main portion is only about 30 feet, decreasing to 20 feet if you include the tidewater tributaries. “It’s just mind-boggling to think of how productive this bay was, even 150 years ago,” Paul adds.
When Captain John Smith sailed this bay four hundred years ago, the water clarity in the bay was exceptional, thanks to the natural filtration provided by oysters, wetlands, and submerged grass beds. Smith wrote that oysters “lay as thick as stones,” and the fish population included “sturgeon, grampus, porpoise, seals, stingrays … brits, mullets, white salmon [rockfish], trout, soles, perch of three sorts” and a variety of shellfish. The schools of fish could be so massive that at one point Smith and his men attempted to catch them with frying pans.
This was an ecosystem managed, to some degree, by the native peoples who lived in dispersed and shifting settlements throughout the region. Drawing on the bounty of the bay itself, as well as the abundant game on land and in the air, plus a variety of farming practices, the peoples of the Chesapeake left gentle footprints on the region compared with the Europeans who followed them.
The Europeans were colonists—coming with the intent to stay, to acquire and transform land, and to produce wealth in the form of cash money, within the context of the emerging global economy. That method of wealth production is pretty straightforward: find an environmental resource—fish, minerals, agricultural land, forests, whatever—and process it on as large a scale as possible to produce the most goods for sale. 400 years ago the impacts of that process on the planet were relatively small and usually recoverable. 400 years later, the bay is struggling with that very recovery.
Colonists set about clearing forests, plowing fields, spreading fertilizer, and interfering with the streams and waterways. The overflow of sediment and fertilizer, and the increase in streamflow from the reduced forest cover, clouded over the underwater grasses, while the increase of nutrients spawned the growth of microscopic algaes and planktons. This is true of estuaries world wide, and as Robert Carter writes, “The decline of estuaries, without a doubt among the planet’s most important nursery grounds, represents one of humanity’s greatest challenges and most obvious management failures.”
Fish wiers
The waters of the bay seem always to be brown with sediment, especially after a rain. As we made our way towards Tangier Island, we saw numerous fish wiers. These are sticks driven into the shallow bottom, holding nets in a funnel shape that guides fish into heart-shaped net pockets. This is the same technology used by Indians, as shown in this 16th-century drawing. The Indians began teaching the Europeans how to do it as early as 1608. Even today, the method is taught by oral tradition.
We didn’t reach Tangier Island that first night, but pulled in at Reedville. Here a Maine sea captain named Elijah Reed had set up shop to fish the vast school of menhaden. A member of the herring family, menhaden are filter-feeders that thrive on zooplankton and phytoplankton, thereby providing a key role in the Chesapeake ecosystem. They are an oily fish, not generally eaten by humans, but processed into fish meal, fish oil and fertilizer. Their incredible abundance in the mid 19th-century turned Reedville into one of the world’s leading fishing ports, with a per capita income among the highest in the United States.
That was then. Today Reedville looks like an odd mix of ghost town, fishing town, and suburb. The menhaden were declared overfished in 2012, owing mostly to the water quality of the bay. Factories have come and gone, leaving rotting carcasses of old warehouses and crumbling remnants of towers where ospreys make their nests. But sprawling old homes speak to the former wealth of the town, and fishing ships are still present. Reedville is also one of the few places where one can catch a ferry to Tangier Island. Master navigator Nainoa Thompson himself, and his entourage of two, joined us here.
In the grey haze and ultimately rain of the next day, we set out for Tangier. “Where are you from?” Mr. Mayor asked me. I told him I was born and raised in Washington, D.C. but that I now live in Baltimore. “Oh,” he said, and looked at his feet. “Then I guess you must be used to being around a whole lot of people.”
Tangier map
Tangier is one of a small group of islands forming a remote outpost in the Chesapeake Bay. It has a population of about 470 people, down from about 1,500 a century ago. Captain John Smith came across these islands in 1608. The island has had a colorful history since then, including a distinct dialect of Tidewater English closer to its British roots than mainstream USA. Much has been written recently about Tangier because of the conflicts over the crabbing industry—the mainstay of the island—and because the island, like the land all around and in the bay, is sinking due to tectonic forces. As such, it provides a model for climate-change-induced sea level rise.
We entered a sea-scape the likes of which I had never seen before: little houses and piers out in the water and all around us. I still think of Tangier Island as the “Venice of the Chesapeake.” We pulled up to the dock in the rain, set up a tarpaulin over the deck, and welcomed the scores of school children that had come to see Hōkūleʻa. Later that evening, after dinner and ceremony, a group of local kids were seated in a circle, along with Nainoa and some of the senior people from the canoe. The older voyagers spoke of the bay, of mālama honua, and of what voyaging has to teach about life on small islands. The young people asked questions, and spoke of their own concerns for the future. One senior member, quoting Mau Piailug’s lesson of how a navigator must “see the island”—the destination—in his or her mind when one starts out on a voyage, told them “you’re already on the canoe, and the future is a distant island. The question is, what kind of future do you want to see? Envision that ‘island,’ and raise it from the sea.”
Hōkūleʻa docked at Tangier Island
We stayed in dormitories of the Chesapeake Bay Foundation on neighboring Point Isabel, and the next day were taken out in one of their boats with Captain Cook to scrape the sea bed. Once the scrapings had been dumped on a sorting table, we were told to set about sorting through the grass to see what we could find. The question posed to us was, How does the health of the bay seem, based on what you see here?
Little baby crabs went skittering all over the place. Pipefish—a relative of the seahorse—wriggled about and were dumped into a large, clear jug of bay water, along with small shrimp and curious bug-like creatures. It looked like abundance, but of course we have no way of knowing how rich it would have been 400 years ago.
Our guides Paul and Page explained the importance of the sea grass and the health of the bay, and how the teaming life on the table in front of us reflected a healthy area, thanks to efforts to reduce the pollutants. “We’re at the southern limit of eelgrass,” Paul explains. “Any one degree of temperature increase moves that boundary north.”
“Eelgrass is a productive habitat and nursery area for a lot of smaller species.” Kirk Havens added, “Decrease the water clarity and we lose the eelgrass. Bigger species, such as water fowl, feed on the smaller species, so there’s a feedback loop.”
Aquarium tank at right contains oysters, which have filtered the cloudy water in that tank. Tank at left contains the same water, but no oysters.
Water clarity was brought home to us at our next stop, a subsidiary campus of Longwood University on Northern Neck Virginia. Two aquarium tanks had been filled with water from the inlet that morning. In one tank, there was nothing but water. In the other tank, there were live oysters. Near the end of the day, the difference between the two tanks was stark. The first one was still cloudy, while the second one had become clear, thanks to the filter-feeding oysters.
Oysters provide three key benefits to the bay: first, they build reefs—massive structures that help stabilize sediment flow. Second, these reefs of alkaline shells provide a chemical buffer against the acidic freshwater that enters the bay, thereby enabling the survival of many marine invertebrates that in larval form need the right pH to survive. And third, they feed on the phytoplankton and zooplankton, cleaning the waters. In fact, biologists have recently estimated that when Captain John Smith sailed here, oysters were so plentiful that they filtered the entire bay once a week. Add to that the massive schools of filter-feeding menhaden and you have pristine waters, clear down to 20 feet or more.
The Indians of the Chesapeake ate oysters, but their technology—and perhaps their sense of balance with nature—limited their ability to harvest them to shallower waters. Early colonists followed suit. But in the 1830s and 40s, the discovery of deeper oyster reefs coupled with the advent of new technologies to harvest, can the oysters and transport them turned the Chesapeake Bay into “a maritime version of the Wild West.” This history is recounted by Dr. Henry M. Miller of Historic St. Mary’s City, and powerfully displayed at the Chesapeake Bay Maritime Museum in St. Michaels, Maryland. Harvest reached 20 million bushels in the 1880s.
View of Tangier Island as Hōkūleʻa approaches.
Again, it is the typical story of modern economics: find a resource and exploit it to the maximum extent possible. And the story ends as they so often do: the resource was over-exploited to the point of depletion, the ecosystem was altered and weakened, and then (in this case) some introduced diseases further devastated the bay’s oysters. As Miller states, “Today, virtually nothing is left of the abundant oyster bars and reefs of the past. Although efforts are being made to restore the native oysters, introduce non-native oyster species, and expand oyster farming, it is uncertain whether they will meet with success. The Chesapeake oyster industry is a classic example of a recurring tendency in human history: use it until it is gone.”
Fortunately efforts to improve the health of the bay have increased in the past few decades, as the extent of the crisis affected more and more industries. But as the country’s largest estuary, the watershed—not to mention the airshed—of the bay is enormous, encompassing several different states and state governments. When efforts began in the 1980s, each jurisdiction made its own rules independently, and they were all voluntary. In 1998, the Chesapeake Bay Foundation (CBF) published the first “State of the Bay,” a report card on the Bay’s health. They graded it a 27 on a scale of 100. Lawsuits have been filed against the Environmental Protection Agency (EPA) for not using its authority to set pollution limits. In 2010, the EPA and its partners developed “the landmark Chesapeake Bay Total Maximum Daily Load (TMDL), setting limits on the amount of nitrogen, phosphorus, and sediment that can enter the Bay and its tidal rivers to meet water quality goals.” A 2010-2025 blueprint was set in place. This year the CBF published its Midpoint assessment report. Many goals have been met, many have not, but there is progress.
At our departure, the Longwood University folks gave us each a fossil shark tooth, which had eroded out of a cliff further up the Potomac. A reminder of how the Earth changes over time, even without human interference. A lesson on how careful we have to be to maintain the bounteous balance that we have, while we can. Mālama honua.
Hōkūleʻa sailing towards Tangier Island (Nà’Àlehu Anthony for Oiwi TV)
Share
Post
Harriet Tubman Underground Railroad Visitor Center
“I never ran my train off track and I never lost a passenger.” Harriet Tubman was fond of saying this in her later years, but during the 1850s when she was actively escorting enslaved people north to freedom using the Underground Railroad (UGRR) network, she was taking grave risks with her own life and liberty as well as that of the people she led. The Harriet Tubman Underground Railroad Visitor Center (HTVC) tells the story of this renowned “conductor” with her words and with exhibits providing insights into her early years and the historic events of her times. Sites and artifacts of the UGRR are limited. After all, its success depended on secrecy.
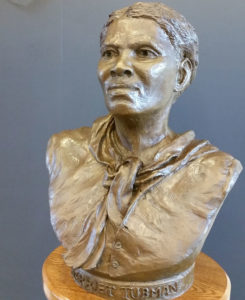
Sculpture by Brendan O’Neill, Sr. The sculptor depicts Tubman at about age 30, approximately when she achieved her freedom. The bust and its pedestal are five feet tall, just Tubman’s height. The scars from whippings stand out on the back of her neck in O’Neill’s sculpture. (Photo by C.W. Cooper)
The history of slavery and of the UGRR is known. This HTVC puts a person, Harriet Tubman, at the center of the historic story. We know where she grew up and the work she did. After she escaped to free territory we know of a number of her trips back to her home region, and we know about many of the family members and friends she helped to escape. Some of the places and people that harbored her and the people with her are known. Most are not. But a drive through this rural landscape of “Chesapeake Bay country” can provide a sense of the woman and the times. Sensitivity to this landscape can help the visitor imagine and understand the events and the people who risked so much to gain so much.
The Site Is the Setting
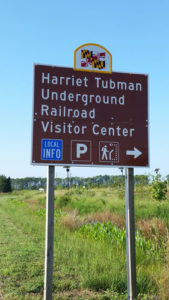
Highway sign at approach to Harriet Tubman Underground Railroad Visitor Center (Photo by C.W. Cooper)
The HTVC in Dorchester County is approximately a two-hour drive from Washington D.C. to the Eastern Shore of Maryland – that is, east of the Chesapeake Bay. The county seat of Dorchester County is Cambridge on the Choptank River. The Cambridge courthouse was the scene of slave auctions and almost the scene of auctions of some of Tubman’s family members.
The HTVC is not at Harriet Tubman’s birthplace, like many national park sites, nor at another notable place in her life. But the landscape around the HTVC and across the broader region is an integral part of her story. The HTVC property is carved from Blackwater National Wildlife Refuge (BNWR), so the setting is protected. The farm fields, woodlands, impoundments and open waters of the refuge provide cover and habitat for the migratory waterfowl and other creatures and give a sense of the mid-nineteenth century landscape.
The land of Tubman’s youth is the coastal plain of Delmarva, a region of farming, timbering, marshes, and rivers. Dorchester County is overwhelmingly low lying and flat. The waterways and the land peninsulas (“necks” in this region) intertwine like the fingers of clasped hands. Places that are nearby as the crow flies may be miles apart as the road winds. Woodland trees are not especially tall, but the woods are thick, and the ground cover can be dense. In marshy areas, “wetlands,” there may by little hillocks of dry land. The roads are now paved and the field crops may differ, but imagination may help the visitor form an impression of former times.
The Historic Setting
Students studying the period leading to the Civil War typically concentrate on the national political scene of presidential elections and federal legislation. The story of a single person leading small groups of individuals through the hazards of escape can give a different perspective to illuminate the political story.
The historic setting of the 1840s and 1850s is one of Northerners’ growing antislavery sentiment and of Southerners’ steadfast commitment to slaveholding in a primarily agrarian economy. Political parties shifted and realigned. Opinions became increasingly entrenched with successive administrations: John Tyler (following death of William Henry Harrison 1840, Whig); James K. Polk (elected 1844, Democrat); Zachary Taylor (elected 1848, Whig); Millard Fillmore (following Taylor’s death in 1850, Whig); Franklin Pierce (elected 1852, Democrat); James Buchanan (elected 1856, Democrat); and finally Abraham Lincoln, elected in 1860, Republican. Other important events: The Missouri Compromise, 1820, set the precedent that new states would be admitted to the Union in pairs, one free state and one slave state together. The Fugitive Slave Act, 1850, provided that escaped slaves found in the North must be returned. The Dred Scott decision in 1857 ruled that Dred Scott, a slave, was not a citizen and had not obtained his freedom because he had been taken from a slave state to a free state; it also essentially ruled the Missouri Compromise unconstitutional. The Lincoln-Douglas debates (1858) made Lincoln well known when he ran for the presidency. Then in April 1861 the South fired on the Union troops at Ft. Sumter in the harbor of Charleston, South Carolina touching off the Civil War.
The history is the big story. But it played out in the lives of individuals on local landscapes. One such individual whose local actions illustrated the larger context is Harriet Tubman in Dorchester County on Maryland’s Eastern Shore.
Harriet Tubman, the Person and Her Actions
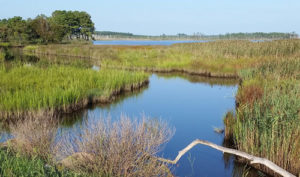
Water, marsh grasses and woodlands in Dorchester County, Maryland (Photo by C.W. Cooper)
Harriet Tubman was born, it is thought, in 1822 near the village of Madison. She was born Araminta Ross, and was called Minty. Her parents, Ben and Harriet (Rit) were slaves owned by different, though related, people. In 1844 Harriet married John Tubman, a free African American, and about that time took her mother’s first name, Harriet (Larson, p. xvi). Tubman’s father was freed in 1840 by act of his deceased owner’s will (Larson p. 27). Tubman’s brothers remained enslaved until she conducted them to Canada in late 1854. In 1855 Ben bought Rit, then 70 years old, for $20. In pre-Civil War Dorchester County, approximately one-half of the African Americans were free.
One incident in Tubman’s childhood had lifetime repercussions. When she was about seven years old, she accompanied a slave woman of her owner’s household to make a purchase at the Bucktown store. Also at the store were another slave and his overseer. As the two men argued and the slave turned to leave, the overseer threw a two-pound counter weight at him mistakenly hitting Tubman in the head. She dropped to the floor unconscious. It was several days before she recovered, and she carried the scar, a dent in her forehead, the rest of her life. Until her death Tubman was prone to suddenly falling asleep, awakening in a few moments, and she had visions and recurring dreams.
As a youngster, aged about six, Tubman was assigned to collect the catch in muskrat traps. Muskrat is a rodent that lives in marshland, about a foot long when fully grown. The hides are most valuable when the muskrat is caught in the winter when the fur is thick. That’s when the water is cold, sometimes frozen over. Checking muskrat traps is a cold, unpleasant assignment.
Harriet’s father, Ben, worked in timbering, cutting trees and hauling the lumber to wharfs to be sent to shipbuilders in Baltimore. In her teens, Tubman worked with him. Tubman was a strong, effective worker. It was not unusual for a slave owner to hire out a slave for wages which would be paid to the owner. When she was about 25 Harriet paid her owner a fee, estimated at $50 – $60, and then for the next year she kept her wages. With her income she bought two oxen which would have boosted her wage rate.
Tubman would have known a number of people in the broader community. In the lumber camps and river docks she would have met people from beyond the immediate region. Water transport was widespread with boats docking at the wharfs of large homes as well as at the town docks. African Americans working on the boats would have brought news of a wider world. Perhaps the most valuable aspect of her varied work and locations was learning to live on the land.
The horrors of slavery were real. “Every time I saw a white man I was afraid of being carried away. I had two sisters carried away in a chain gang ― one of them left two children. We were always uneasy” (HTVC). The sculptured bust of Tubman displayed in the HTVC includes the raised scars on the back of her neck ― marks of whipping.
Harriet Tubman was determined to be free. As she said looking back in 1886, “I had reasoned this out in my mind; there was one of two things I had a right to, liberty or death; if I could not have one, I would have the other, for no man should take me alive” (HTVC).
After an aborted attempt to escape with her brothers, she went alone. She left after dark one Saturday night in 1849 (Adler p.23). With no work done on Sunday, she would not be missed for two days. Looking back on that 1849 flight to freedom and thinking about her feelings as she crossed into a free state, she said, “When I found I had crossed that line, I looked at my hands to see if I was the same person. There was such a glory over everything the sun came like gold through the trees, and over the fields, and I felt like I was in heaven” (HTVC). What was unexpected in the following weeks, was how much she missed her family. She determined that they too should be free and that she would see to it. Yet every time she returned to Dorchester County to lead others north, she was traveling from a safe place to a place of danger – a place where detection and capture meant the probability of a whipping, or worse, and the possibility of being “sold south.”
In late 1850 through friends, John Bowley, a free African American, contacted Tubman for help. This took some coordination. He was a ship carpenter in Baltimore, but his enslaved family still lived on their owner’s farm on the Eastern Shore. Bowley’s wife, Kessiah, a niece of Tubman, together with the couple’s two young children, was to be sold in an auction on the courthouse steps in Cambridge. Tubman got to Baltimore and met with Bowley to plan his wife’s escape. At the auction, Bowley made the highest bid for the woman and the two children. The officials managing the auction broke for lunch and returned to collect payment but found that the high bidder was no longer around. As they started to re-auction Kessiah, they realized she too was gone. The four members of the Bowley family hid in a nearby cellar and slipped away at night in a small boat on the Choptank River and then sailed to Baltimore where they met Tubman who guided them north to Philadelphia and freedom (Adler p. 48). December weather added to the hazard of the 75-mile journey up the Chesapeake Bay to Baltimore.
In preparing for another journey, Tubman sent a coded letter message to a friend. When the suspicious postal inspectors could not find anything wrong, they handed the letter to the intended recipient who read it, understood the message and tossed the letter back saying it made no sense to him. He then went and alerted Tubman’s brothers to be ready to leave at a moment’s notice.
After gaining his freedom, Tubman’s father had established a home for himself and Rit in Poplar Neck in Caroline County, 40 miles from the Brodess Plantation, where Harriet’s brothers lived near Bucktown. On Christmas Eve, 1854, the brothers went to their parents’ home. Eight people waited in a corncrib, unwilling to let Rit Ross know her children were so close for fear her emotions would alert other people. Ben Ross brought food to them. Knowing he’d be questioned by slave catchers and wanting to answer truthfully that he “hadn’t seen them,” Ben covered his eyes with a handkerchief as he helped his grown children.
Tubman had an unshakable faith that God would protect her and would show her the way to safety in the years she led people north to freedom. One time she was escorting a number of escaping slaves. She had a premonition of danger and immediately left the road leading her “passengers” to wade through chest deep water to cross a river. The danger was real since slave catchers were waiting ahead on the road. Describing her safe escape, she said “It wasn’t me. It was the Lord” (Adler p. 59).
In all, Tubman made, it is believed, 13 trips between the Eastern Shore and free lands, escorting 70 enslaved persons to freedom, and her advice helped at least 50 others escape. No wonder she was called “Moses.” In later years she was fond of saying, “I never ran my train off track and I never lost a passenger” (Adler p.4).
After the Civil War broke out, Tubman went south and aided efforts of the Union Army. She went on one raid up the Combahee River in South Carolina to disrupt Confederate supply lines. As slaves in plantations along the river realized the boats were Union boats, they swam to get aboard. Tubman also helped in the field hospitals for the black troops and distributed food and clothes to escaping slaves who flocked to the Union camps. In later years, Tubman made her home in Auburn, New York, where her parents and some siblings had settled after the war and after returning to the United States from Canada. Tubman actively supported women’s suffrage. She died in 1913.
The Harriet Tubman Underground Railroad Visitor Center
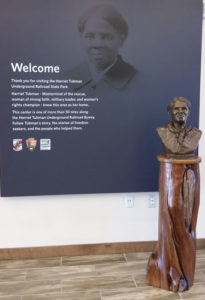
Harriet Tubman Underground Railroad Visitor Center exhibit with sculptural bust and welcome signage (Photo by C.W. Cooper)
The Harriet Tubman Underground Railroad Visitor Center tells the story of Harriet Tubman’s life in the context of her times. The design concept of the visitor center is “The View North,” referencing the direction the slaves took towards freedom setting their course by the North Star. The layout of the building and the exhibits within it follow a progression northward.
Although not particularly “high tech,” the exhibits, the artifacts of model cabins, the two-pound weight, the video of the region with a narrative commentary of her escape trips all contribute to an immersion in Tubman’s world. The context includes acknowledgment of the dangers risked by other people, both enslaved and free, in helping the passengers along on the “railroad.”
Born into slavery, Tubman was small and unable to read and write. She freed herself and others and continued to be a voice for individual rights all her life. The HTVC presents her story. The setting, the Dorchester County landscape, is an integral part of the story.
Adler, David A. 2013. Harriet Tubman and the Underground Railroad. New York: Holiday House. This biography is often classified in the children’s or youth portion of a library.
Larson, Kate Clifford. 2004. Bound for the Promised Land. New York: Ballantine Books. This is a full-length biography of Harriet Tubman.
Lockhart, Barbara M. 2012. Elizabeth’s Field. North Charleston, South Carolina: c. Barbara M. Lockhart. This book of fiction is based on extensive research and the personal oral history with the author’s elderly African American neighbor who heard the stories first hand. The author’s land had been owned briefly in the 1850s by a freed African American woman. This unusual event gave rise to extensive research and this fictional account weaving the lives of slaves and free, owner and slave, and the life of the times. Today’s high school and college students find it to be the basis of discussion and enhanced appreciation for people and place. Copies of Elizabeth’s Field are available at the HTVC and through Amazon.
Harriet Tubman Underground Railroad Byway (Tubman Byway) — The Byway maps a route of over 130 miles in Maryland, Delaware and Pennsylvania showing over 30 sites linked with Tubman’s life and work.
Chesapeake Bay Maritime Museum, St. Michael’s, Maryland — The 18-acre campus on the Miles River is an active center with historic watercraft and interpretive displays of life in the region, watermen, farmers, tourists, people who have made their living from the Chesapeake Bay and the region.
Share
Annual Meeting
The Resilient Streams in the Urban Landscape of Washington, D.C.
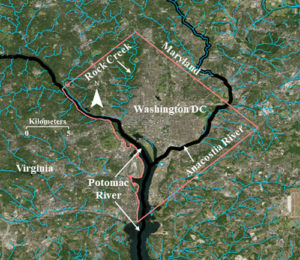
The process of urbanization often leads to the alteration of local streams. Such alterations range from complete disappearance of streams by making them flow underground, converting them into canals, loss of their aquatic habitat, and changes in their morphology (Kang and Marston 2006; Kang 2007) . In Washington, D.C. many streams and springs have disappeared during the last 200 years of urban development and federal growth (Williams 1977) . The two rivers bordering the city, the Potomac and Anacostia rivers, and the National Mall within the city, look very different as compared to their respective landscape characteristics in the 1700s due to changing sediment and runoff volumes. In Figure 1 you can see that the current stream density within the city and the surrounding areas reveals a significant difference (Figure 1). However, some times the local conditions of streams are resilient enough to counter the effects of the urban runoff (Kang 2007; Kang and Marston 2006).
Figure 1: A Visual Depiction of the Current Variable Density of the Stream Network within and outside Washington DC (Source: USGS)
While many local streams have disappeared, the resilient Rock Creek continues to drain the western portion of the national city into the Potomac River. The prominent names among the streams that disappeared include Smith Spring, Frankling Park Springs, Gibson’s Spring, Caffrey’s Spring, City Spring, and Tiber Spring (Williams 1977) . While some of them are underground, others were converted into canals or significantly reduced in their coverage for the development of the city. However, Rock Creek has successfully survived through the impervious development of the city.
Despite ambitious urban growth, the federal government protected the Rock Creek Park so that Rock Creek could meander through its flood plain. It is also a vibrant ecosystem supporting aquatic life as well as wildlife in its flood plain. One of the cherished experiences of many Washingtonians is to witness a rich variety of wild life as they conclude their late evening commute from work through the Rock Creek Parkway that partially runs through the flood plains of Rock Creek.
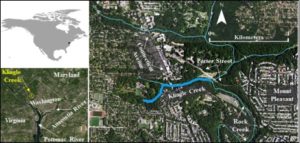
Figure 2: Location of Klingle Creek in Washington, D.C. (Source: USGS)
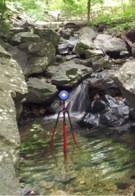
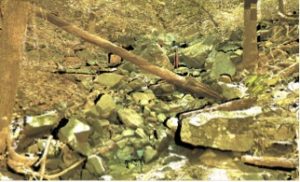
The successful survival of Rock Creek during the last century of urban growth is also because of its equally resilient tributaries that kept it alive and strong. Tributaries such as Klingle Creek (Figure 2), offer a microcosm to understand the resilient structure and ecology of this national creek. Klingle Creek is a small urban branch of Rock Creek and flows through the neighborhoods of Woodley Park, Cleveland Park, and Mount Pleasant in the city of Washington. It is unique to Rock Creek because of its geomorphic survival during the changing land cover politics around it. Surrounded by highly urbanized landscape, Klingle Creek presents a healthy ecosystem with a variety of fluvial processes. The stream has adjusted to the surrounding highly impervious landscape in a synergistic fashion. Starting as a narrow channel at the headwater, its capacity gradually increases in the downstream direction to accommodate the urban run-off. Various sections in the upstream portion of Klingle Creek experience bank erosion allowing for a sediment supply for the lower portion. The lower portion of the creek includes large rocks creating beautiful waterfalls (Figure 3) while reducing the velocity of the urban flow. It also provides sediment traps for various types of aquatic habitat (Figure 4). Many portions of the creek present lush moss covered rocks and woody debris offering a soothing experience to nature lovers.
Figure 3: Large rocks creating a waterfall in the lower portion of Klingle Creek (Source: Ranbir Kang, 2015)
Figure 4: A medium resolution point cloud (draped with colors from orthoimages) showing the sorting of large rocks in the lower portion of Klingle Creek to trap sediment (Source: Ranbir Kang, 2015)
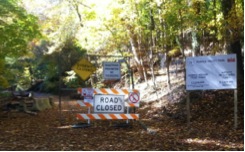
Despite a highly urban landscape comprising its watershed, Klingle Creek is lined by a riparian corridor with a thick tree canopy. While the occasional tree fall offers woody debris to regulate the eco-geomorphology of the stream, a thick tree canopy helps promote the interception of rainwater. Therefore, it has played an important role in the survival of Rock Creek against the urban sprawl in the heart of our capital. For a long time, Klingle road (which ran parallel to Klingle Creek) was used by locals as a quick access between Cortland Place and Porter Street. However, the frequent flooding and maintenance costs of the road made the city think about alternatives to the road which led to the calls for saving Klingle Valley. While various groups of the community gathered support to remove the road, other groups gathered in favor of keeping the road. The battle grew until the dispute reached the City Council and in 1991, the road was barricaded (Figure 5).
Figure 5: The barricaded entrance to Klingle Road in 2015. The Creek is located on the left of the barricade while facing it. (Source: Ranbir Kang)
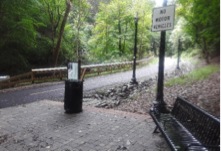
Figure 6: The entrance to the new multi-use Klingle Trail in 2015. The Creek is located on the left while facing the trash can. (Source: Ranbir Kang)
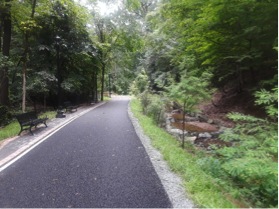
After more than two decades of dispute, in 2015 the barricaded portion of Klingle Road was replaced by a multi-use trail (Figure 6). The trail offers a variety of recreational opportunities for users of all age groups. One side of the new trail is bordered by Klingle Creek and the other side includes the historical woodland garden of the Tregaron Conservancy. While benches along the trail offer a view of the creek (Figure 7), the trail also connects the recreational communities of two neighborhoods in the city.
Figure 7: Benches along the new Klingle Trail to enjoy the view of the Klingle Creek. (Source: Ranbir Kang)
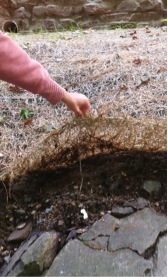
Figure 8: Post restoration use of a matting to protect the stream banks of the restored portion of Klingle Creek. (Source: Ranbir Kang)
The process of replacing the road with a trail included restoring various sections of Klingle Creek through alterations of the stream banks and creating a sequence of steps and pools along the stream. It also included efforts to modify the banks by planting native vegetation and covering various portions of the bank with protective matting (Figure 8)..
The replacement of the road with a trail along Klingle Creek is an example of geodesign. There are numerous cases of urban areas across the globe where communities and city officials worked together in geodesigning their cities with a sustainable futuristic approach (Beatley 2016). The high line project in New York City and the urban parks in the city of Singapore are just two more examples where cities introduced green zones within the highly urbanized landscapes to connect their communities with nature using softer sustainable architectural designs. Economics is often one of the major driving forces behind such conservation and restoration initiatives so that the long term future demands are met with minimal cost. The ecological challenges and experiences of residents in Klingle Valley during the next decade will determine the effects of the restored creek on the larger Rock Creek, the role and functions of the new trail, and the appropriateness of restoration design and expenditures in the Klingle Valley restoration project. Klingle Valley, an urban creek along with its sister tributaries of Rock Creek offer us a soothing experience and a quick get away from the urban stress. With Washington moving forward as a sustainable city, Klingle Creek complements that ambition as a resilient hydrology of Anthropocene.
Ranbir Kang is an associate professor at Western Illinois University. With a long term research interest in the Washington metropolitan area, he specializes in urban hydrology, human impact on fluvial systems, and high resolution river surveys.
AAG Members get exclusive access to publications, prominent journals, unique advocacy, grant, scholarship and professional opportunities with access to industry focus communities, and event discounts, including our annual meeting.
Some content may only be accessible if you belong to specific Specialty or Affinity Groups. You can still update your membership below. You will need to go through the Join flow, but you do not need to repurchase your membership unless it is expired or about to expire.
To provide the best experiences, we use technologies like cookies to store and/or access device information. Consenting to these technologies will allow us to process data such as browsing behavior or unique IDs on this site. Not consenting or withdrawing consent, may adversely affect certain features and functions.
Functional
Always active
The technical storage or access is strictly necessary for the legitimate purpose of enabling the use of a specific service explicitly requested by the subscriber or user, or for the sole purpose of carrying out the transmission of a communication over an electronic communications network.
Preferences
The technical storage or access is necessary for the legitimate purpose of storing preferences that are not requested by the subscriber or user.
Statistics
The technical storage or access that is used exclusively for statistical purposes.The technical storage or access that is used exclusively for anonymous statistical purposes. Without a subpoena, voluntary compliance on the part of your Internet Service Provider, or additional records from a third party, information stored or retrieved for this purpose alone cannot usually be used to identify you.
Marketing
The technical storage or access is required to create user profiles to send advertising, or to track the user on a website or across several websites for similar marketing purposes.
 We’re getting closer to the 2021 AAG Annual Meeting! Whether you will be attending the meeting all week, for a few days, or catching up with recordings of presentations between other obligations, there are plenty of ways to get involved using social media. Social media is a great way for seasoned conference goers and newcomers alike to network, report on new research, engage in lively debate with those inside and outside of the discipline, and find out what’s going on during the largest geography conference in the world. Start planning your #AAG2021 social media strategy today with these helpful guidelines:


 Linked in
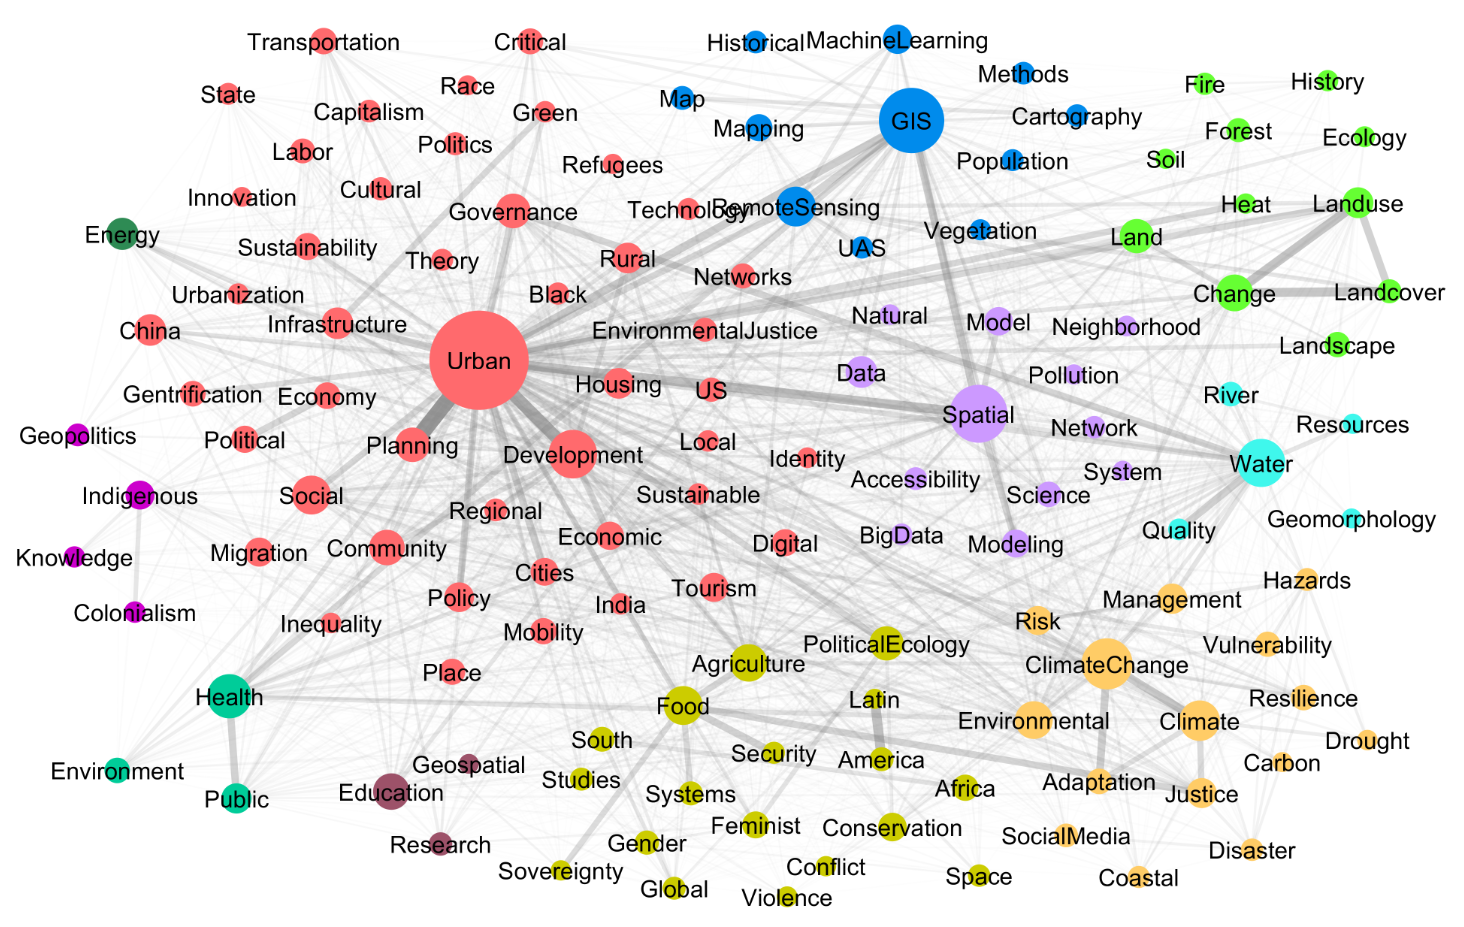

 We’re getting closer to the 2019 AAG Annual Meeting! Whether you will be attending the meeting all week, for a few days, or looking to follow the action from afar, there are plenty of ways to get involved using social media. Social media is a great way for seasoned conference goers and newcomers alike to network, report on new research, engage in lively debate with those inside and outside of the discipline, and find out what’s going on during the largest geography conference in the world! Start planning your #aagDC social media strategy today with these helpful guidelines!