Chicago’s Asian Cultures
 The Association of American Geographers (AAG) will be holding its next annual meeting April 21-25, 2015, in the American business hub city of Chicago, which can be reached by a direct flight from Beijing, Shanghai, Hong Kong, and many other major Asian cities. It is little wonder that many Asian cultures feel at home here in America’s heartland global city. On December 19 2014, the “25th U.S. – China Joint Commission on Commerce and Trade” concluded in Chicago. The Chicago Tribune reported that Beijing economic development official Cheng Yuhua expected a dingy industrial city, but the real Chicago surprised her: “What I’ve seen here – it completely changed my mind, the city looks young, it’s full of energy (Chicago Tribune, 21 December 2014).” Although the meeting was focused on U.S. trade, local Chicago got a fair bump in marketing itself as a global city open to foreign investment.
Asians in Chicago
In this newsletter article I will describe the residential patterns of six major Asian immigrant groups – Asian Indians, Chinese, Filipinos, Japanese, Koreans, and Vietnamese – in the Chicago metropolitan area. Using the 2010 Census and GIS, I will address two questions: (1) Where are the six major Asian groups most heavily concentrated in the city of Chicago, and in the 13-county metropolitan area? (2) Which of the six Asian groups is more dispersed in the city of Chicago? Mean centers and standard deviational ellipses are employed to describe the concentration differences.
1990 to 2000
This article also provides an update to an earlier study that used 1990 and 2000 census data to describe the geographic distribution of Asian groups (Park, Chung, & Choi, 2006). Their study identified Asian Indians as the fastest growing group, which settled primarily in DuPage County and northern Cook County, while the Chinese remained concentrated in Chinatown with some expansion to the south and southwestern suburbs (Park et al., 2006). Japanese and Koreans were concentrated in the north, while Vietnamese were concentrated in the city and in a few western suburbs (Park et al., 2006). Filipinos were bi-polarized commensurate with their socioeconomic status (Park et al., 2006). Suburbs like Lincolnwood and Skokie were strongly favored by all six Asian groups, due to employment opportunities in those areas. Traditional Asian enclaves in the inner-city area remained port of entry zones, and even expanded geographically over time, while new Asian concentrations emerged in relatively affluent suburbs (Park et al., 2006). According to the study, Asian groups maintained strong social cohesion, indicating that Asian residential patterns were closely linked to economic factors, while keeping close ties with their own respective groups.
2010 Chicago Region and its Suburbs
Based on a 13-county definition of the Chicago region, a dot density and graduated color map (fig. 1 and 2) show that the six major Asian groups occupy distinct geographical spaces and have varying spatial distributions. Asian Indians are highly concentrated northwest of Chicago in Buffalo Grove, Hoffman Estates, Schaumburg, Lincolnwood, Skokie, and Devon Avenue. The trend toward concentration in DuPage County and northern Cook County has intensified in 2010 compared to previous years. The Chinese are highly dominant in Chicago’s Chinatown (Photo 1), but have also spread to suburbs like Vernon Hills, Skokie, Evanston, Schaumburg, Hoffman Estates, Naperville and Aurora. Their strong concentration areas remain in the southern half of the Chicago metro area, but communities have developed in northern suburbs, including southern Lake County and northern Kane County. Filipinos are scattered to a greater extent around the metropolitan than many other Asian groups. Their high concentrations are found in Morton Grove, Wilmette, Skokie, Carol Stream, Glendale Heights, Streamwood and Hoffman Estates.
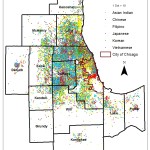
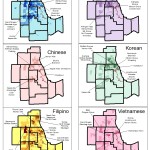
The Japanese are mostly concentrated northwest of the city, in the suburbs of Elk Grove, Schaumburg, Arlington Heights, Mount Prospect, Inverness, Skokie, Morton Grove, Lincolnwood, Lincoln hire and Buffalo Grove. For Koreans, there is a great dominance around Chicago’s Korea town, but also in north and northwestern suburbs including Lincolnwood, Wilmette, Skokie, Evanston, Northbrook, Glenview, Morton Grove and Wheeling. Japanese are also increasing in Buffalo Groves, Vernon Hills, Inverness, Hoffman Estates, Schaumburg, and Naperville. The Vietnamese are more scattered, but there is a notable concentration on the north side of the city of Chicago.
There are several suburbs in which all six major Asian groups are concentrated, mostly the northern half of the Chicago metropolitan region. Asian Indians and Filipinos, who are relatively more fluent in English, tend to assimilate into the mainstream and are dispersed to a greater extent around the metropolitan area than are other Asian nationalities. Suburbs like Skokie, Lincolnwood, Morton Grove, Hoffman Estates and Schaumburg are popular residential locations among the Asian groups. All six concentrate across the northern limits of the city of Chicago, where many high skilled job opportunities are located. The higher income professionals of Asian Indians, Japanese, and Koreans favor edge cities, such as Schaumburg and Hoffman Estates. One prominent trend is the rise of Asian populations in western suburbs like Carol Stream, Glendale Heights, Elgin and Pingree Grove, as well as in southern suburbs like Naperville and Aurora. Compared to 2000, Elgin, Pingree Grove and Gilberts in Kane County have experienced an influx of all six Asian groups.
2010 City of Chicago
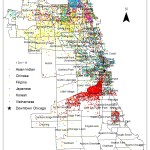
The 2010 Census reported that the city of Chicago had an Asian population of 166,770, placing it as the 7th ranked city in the USA for the number of Asians (Census 2010). In the city of Chicago (fig. 3 and 4), a similar residential pattern is visible among all six groups, with high concentrations in the northeastern part of the city – the neighborhoods of Uptown, Rogers Park, Albany Park, West Ridge, North Park, and Lincoln Square. Asian populations are also dominant near Downtown Chicago, especially in the Loop and Millennium Park neighborhoods. All six groups, especially Chinese, are also concentrated in Hyde Park, which is home to the University of Chicago. Besides Chinatown, Bridgeport, and Armour Square, which all have sizable Chinese populations, Argyle in the Uptown neighborhood is becoming a new Chinatown (Photo 2), as well as a distinctive Vietnamese enclave.
Spatial Analysis
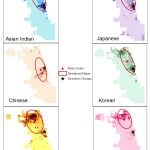
The Chinese mean center is closest to Downtown Chicago, at a distance of 2.76 km. This is followed by the Korean (6.91 km), Asian Indian (7.41 km), and Japanese (7.74 km) mean centers. The Filipino mean center (10.38 km) is relatively far from downtown, and the Vietnamese center is the furthest at 11.74 km. The standard deviational ellipses suggest that the Chinese are the most spatially concentrated, with an ellipse area of 100.3 km2. The Vietnamese and Koreans are also relatively concentrated, with ellipse areas of 112.9 km2 and 119.5 km2 respectively. These are followed by Asian Indians (142.3 km2), Japanese (153.4 km2), and Filipinos, with the greatest spatial dispersion (ellipse area 162.9 km2). The ellipse of each group overlaps with the other five, although Filipinos and Vietnamese are concentrated mostly in the city’s north side, while the Chinese are dominant in neighborhoods around Chinatown spreading toward the southwest. The almost circular shapes of the Filipino and Vietnamese ellipses suggest that these two groups are dispersed in nearly equal directions from their mean centers. The Asian Indian, Chinese, Japanese, and Korean ellipses are elongated, with the Korean ellipse being the most stretched.

In conclusion, Asian groups in Chicago are culturally diverse and occupy different geographical spaces according to their home country. The spatial distribution of the six major Asian groups became more dispersed throughout the Chicago metropolitan area over time, although several suburbs, as well as neighborhoods within the city, are popular among all groups. Besides traditional Asian suburbs like Skokie, new communities in Elgin, Carol Stream and Naperville are on the rise. While visiting Chicago during the AAG annual meeting in 2015, it is worth taking time to appreciate this diverse Asian culture. Choices include dinner in Chinatown, which is a short taxi ride from the convention hotel, or an afternoon in Chicago’s New Chinatown, which can be accessed by the red line train on the Argyle stop. In the suburbs, one can also visit a Chinese grocery store in Naperville or a Japanese grocery store in Schaumburg for a taste of Asian culture!
Jiahe “Caitlyn” Wei
Northwestern University
References
Chicago Tribune (December 21, 2014). “Chicago’s China challenge.” Section 2, page 3.
Park, S., Chung, S-Y., & Choi, J. (2006). “Asians in Chicago.” In Greene, R. P., Bouman, M. J., & Grammenos, D., Chicago’s Geographies: Metropolis for the 21st century (pp. 217-231). Washington, D.C.: Association of American Geographers.
U.S. Census Bureau (2012). The Asian population: 2010. Available at https://www.census.gov/prod/cen2010/briefs/c2010br-11.pdf