Why should geographers care about data science?
By Canserina Kurnia, Esri Senior Solution Engineer for Education, and Joseph Kerski, Ph.D., GISP, Esri Education Manager
Data science is the study of data. Data science involves developing methods of recording, storing, and analyzing data to effectively extract useful information. The discipline of geography has always been focused on data science, because geographers have always been keen to gather, analyze, and make sense of large volumes of data across a wide variety of scales and covering a wide variety of themes, from ecoregions to individual census blocks. Those using GIS are spatial data scientists: They combine their data with theoretical foundations such as Tobler’s First Law to explain and predict. As they visualize and analyze data, they detect patterns and relationships, testing real-world phenomena against hypotheses.
Why is geographic thinking and spatial analysis important to data science? Incorporating spatial analytics into data science allows analysts to extract deeper insight from data using a comprehensive set of analytical methods and spatial algorithms. These methods and algorithms include machine learning and deep learning techniques. Machine Learning (ML) refers to a set of data-driven algorithms and techniques that automate the prediction, classification, and clustering of data. Machine learning can play a critical role in spatial problem solving in a wide range of application areas, from image classification to spatial pattern detection to multivariate prediction. Deep learning is a type of machine learning that relies on multiple layers of nonlinear processing for feature identification and pattern recognition described in a model.
Geographers will no doubt find resonance with terms such as algorithms, classification, clustering, and pattern detection. Indeed, data science represents an opportunity for geographers to promote the value of geographic thinking throughout the academy and in the workplace. The rise of data science in academia and the workplace provides geographers with some new opportunities to demonstrate the relevance of their discipline, one that is high-tech and data-driven. In so doing, geographers can work in innovative ways with data science students and faculty, introducing them to the value of the geographic perspective and geographic tools. This work can lead to collaboration on research projects and jointly offered courses. Geographers can also work with employers to develop new internship programs and other opportunities for their students grounded in spatial thinking and data science.
Geographic Understanding + Data Science = Spatial Data Science
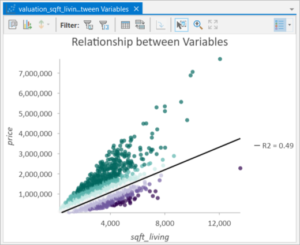 At left is a data-driven valuation model for the housing market for King County, Washington, USA.
When we chart the relationship between variables, in this case price and living space (measured in square feet), the dark green and dark purple indicate a large mismatch between predicted sale price of the homes and actual sale price of the homes. Ideally, data points should be close to the line. The closer to the line the data points are, the stronger the relationship is between the two variables.
In the chart, green colors indicate an underestimation of the sale price of the home, where the actual price of the house is higher than the one predicted by the model. The purple color indicates an overestimation, where the predicted price is above the actual price of the house. How can this situation happen?
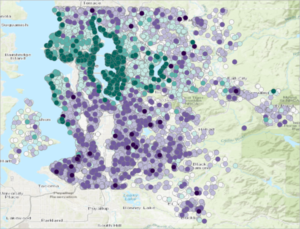 Looking at the map at the left, the darker green points cluster around bodies of water, and people are willing to pay more to have a house near the water body. The regression model is systematically underestimating the sale price of the houses close to water bodies. It looks as though small changes to the size of the living space may result in bigger changes to the price of a house close to a water body compared to a house that is inland. So, location matters, and in this example, incorporating spatial data is crucial in modeling and understanding the complete situation. In addition, visualizing the data on the map make it easy to observe the trend and distribution.
The Building Blocks of Spatial Data Science
Spatial data science is the intersection of geography and data science; it incorporates geographic understanding into existing data science methods to improve predictive models and results. This house value scenario provides a simple example of the type of questions spatial data science can address. But how do we learn spatial data science and apply it to our work?
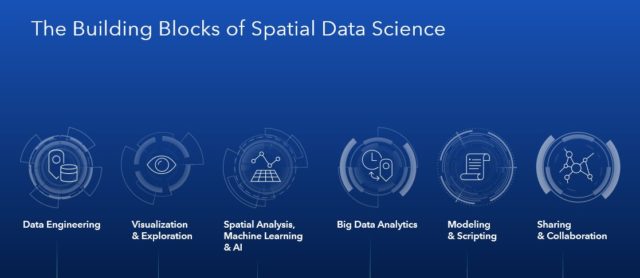
Spatial data science starts with Data Engineering. This refers to making sure the data is ready for our use. Visualization and exploration are next: We seek to understand the data and get a sense what we can solve with the data. We visualize and explore the data throughout the process and share the results. We use Spatial Analysis, Machine Learning and AI to layer the algorithms, methods, and approaches that allow us to break down the problem and create the model. This process turns data into information and often motivates us to take action.
These methods increasingly use larger data sets, such as a collection of imagery or a large vector data set, or real time streaming data from the Internet of Things. We use modeling and scripting, and Big Data Analytics, to Model the phenomena and automate the functionality. We employ Sharing and Collaboration to convey the results. No matter how good the analysis is, if it is not shared with other, no action will be taken, and no improvements to the situation will be possible. Creating and sharing a story map, a dashboard, or one or more infographics enables others to understand the location, scope, and nature of the problem or situation, and allows for the gathering of stakeholders to arrive at a solution.
Integration
ArcGIS includes machine learning tools for performing classification, clustering, and prediction. An example case for Classification is to classify impervious surfaces based on the latest high-resolution imagery to help effectively prepare for storm and flood events. Another example is for prediction: Accurately predict impacts of climate change on local temperature using global climate model data. An example for clustering is: Grouping the traffic patterns into traffic zones that can be used to elicit feedback from current drivers in the area.
As engaging and powerful as the tools are, integrating the tools is important. How can students and those in the workplace understand how data science works and integrate spatial components in data science? Nowadays, many open source machine learning frameworks exist, such as TensorFlow and scikit-learn. These provide libraries for machine learning and deep learning. ArcGIS includes ready to use tools, methods and algorithms to support building blocks of spatial data science. ArcGIS Pro is a powerful desktop application that is used widely by the scientific community as a spatial analysis workstation, with ready-to-use tools for spatial data science modeling.
Equally importantly, integration between ArcGIS and open source data science machine learning libraries through Python and R is available. For Python, ArcGIS Notebooks allow the Jupyter notebook environment to access open source python libraries and the ArcGIS API for Python and ArcPy, which supports the backend of ArcGIS geoprocessing capabilities. For R, the ArcGIS R-Bridge connects ArcGIS to R, allowing for statistical analysis results to be easily mapped in 2D and 3D. Conversely, the bridge also allows data from the GIS to be input into R for statistical analysis.
Value-added Skills
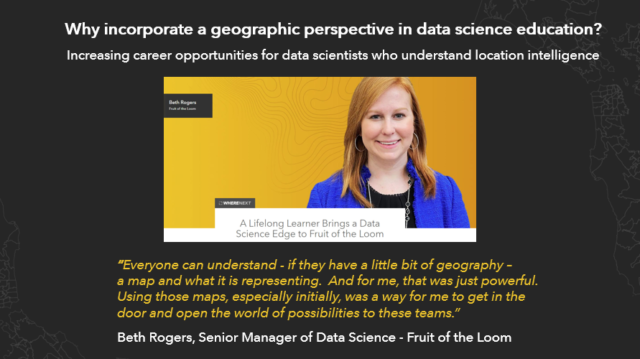
Adding data science to teaching spatial analytics builds highly marketable skills that are sought by nonprofit organizations, private companies, government agencies, and academia. This article shows how Fruit of the Loom hired recently graduating students as the company’s data analysts.
Conclusion
Spatial analytics is a fundamental part of data science. Combining the power of the two brings deeper insights to analysis. The job market for data scientists who understand location intelligence is growing. And ready-to-use tools, open data, and integration tools are already available to enrich teaching and research.
Next steps
Explore resources for Spatial Data Science in Higher Education to learn how to bring spatial data science into your research and teaching. You’ll find lessons, web courses, webinars, sample notebooks and other resources to build your own skills and inspire your students and colleagues.
Featured Articles is a special section of the AAG Newsletter where AAG sponsors highlight recent programs and activities of significance to geographers and members of the AAG. To sponsor the AAG and submit an article, please contact Oscar Larson olarson [at] aag [dot] org.